Agile HR Analytics Insights

Stay Informed: Unpacking Today's Trends

Categories
5 min read

Power BI Embedded vs Published Apps for Secure Global HR Dashboard Delivery

Overview: Two Paths to Secure Global HR Dashboard Delivery Organizations managing HR analytics at enterprise scale face a critical decision:...

5 min read

Serving Attrition Models: Azure ML Endpoints vs Embedded DAX and Power BI Approaches

Overview: Two Paths to Predictive Attrition Analytics When building enterprise HR analytics solutions, one of the most critical decisions data...

5 min read

Pay Equity Auditing Methods: Traditional Statistical Tests vs Machine Learning Approaches

Understanding Pay Equity Auditing in the Modern Enterprise Pay equity has become one of the most critical compliance and fairness...

5 min read

7 Common HRIS-to-Agile HR Analytics Integration Patterns and When to Use Them

Why HRIS Integration Patterns Matter for Your HR Analytics Strategy Integrating your Human Resource Information System (HRIS) with an HR...

5 min read

6 Data Fields Finance Should Provide for Accurate Total Workforce Cost Modeling

Why Accurate Workforce Cost Modeling Matters Total workforce cost modeling stands at the intersection of human resources and financial planning,...

5 min read

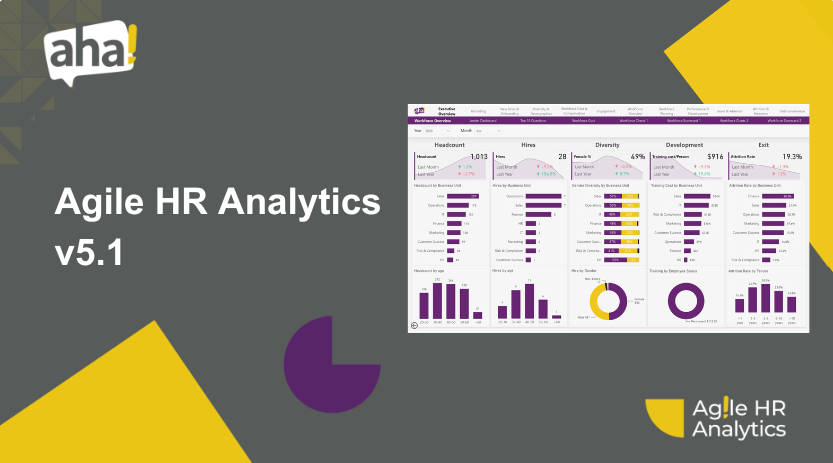
Agile HR Analytics v5.1

From Insight to Workforce Planning While Version 5.0 focused on creating clarity through standardization, consistency, and data reliability, Agile HR...

5 min read

AI Workforce Intelligence for the Public Sector: Bridging HR and IT with Microsoft

Public sector organisations are experiencing a major shift in how they manage, understand, and act on workforce data. As workforce...

5 min read

Moving Beyond Dashboards: How AI Agents Are Redefining Workforce Intelligence

Most organizations don’t have a workforce data problem. They have an access-to-insight problem. Every day, HR leaders are asked critical...

Deploy an Attrition Model Monitoring and Drift Detection Pipeline in Azure
5 min read

Deploy an Attrition Model Monitoring and Drift Detection Pipeline in Azure

Introduction Enterprise HR organizations face a critical challenge: predictive attrition models that perform well in development often degrade in production...

Categories

6 Data Fields Finance Should Provide for Accurate Total Workforce Cost Modeling

Why Accurate Workforce Cost Modeling Matters Total workforce cost modeling stands at the intersection of human resources and financial planning, yet many organizations struggle to align these two critical functions. When finance and HR operate in silos, the result is incomplete data, inaccurate forecasts, and missed opportunities for strategic decision-making. According to research on workforce modeling fundamentals for FP&A teams, the most successful organizations treat workforce cost as a core financial metric that demands the same rigor as any other business expense. The challenge is straightforward: HR teams track employee information, compensation, and benefits through HRIS systems, while finance manages budgets, payroll, and cost allocations through accounting systems. Without a unified data strategy, these systems remain disconnected, leading to discrepancies in reporting and forecasting. This is where HR data integration becomes essential. When finance provides the right data fields to HR analytics teams, organizations can build comprehensive workforce cost models that inform strategic decisions about hiring, compensation, restructuring, and long-term financial planning. For CHROs, people analytics leaders, and finance business partners, understanding which data fields are non-negotiable is the first step toward building an accurate, actionable workforce cost model. Using platforms like Agile HR Analytics, which integrates HR, payroll, and business data through ready-to-use dashboards and AI-powered insights, organizations can transform fragmented data into strategic intelligence. This article outlines the six critical data fields that finance must provide to ensure your workforce cost models are both accurate and actionable. 1. Base Salary and Compensation Structure Data Base salary is the foundation of any workforce cost model, yet its definition and application vary significantly across organizations. Finance must provide detailed compensation structure data that goes beyond a simple annual salary figure. This includes the current base salary for each employee, salary bands by role or level, and any recent salary adjustments or market-rate changes. What makes this data field critical is that it serves as the anchor for all downstream cost calculations. When finance provides clean, standardized salary data, HR analytics teams can build models that forecast compensation costs under different scenarios. For instance, if your organization is planning a 3% merit increase across the board, accurate base salary data allows you to model the financial impact with precision. Additionally, understanding salary structures by job family, department, or geography enables more granular workforce cost analysis. Finance should also provide information about salary adjustment schedules, such as annual review cycles or promotion patterns. This allows analytics teams to forecast future compensation costs rather than simply reporting historical spend. According to workforce cost forecasting best practices, salary data is the single largest component of total workforce cost, often representing 50-60% of total labor expenses. When implementing HR analytics dashboards in Power BI, clean salary data is essential for creating accurate compensation analysis and supporting pay equity compliance initiatives. Finance teams should ensure that salary data is updated regularly, validated for accuracy, and provided in a standardized format that can be easily integrated with HR systems. 2. Benefits and Total Rewards Cost Data Base salary tells only part of the story. Benefits and total rewards represent a substantial portion of total workforce cost, often accounting for 25-35% of total labor expenses. Finance must provide comprehensive data on all benefits costs, including health insurance premiums (both employer and employee contributions), retirement plan contributions, life insurance, disability insurance, wellness programs, and any other employee benefits. This data field is particularly important because benefits costs vary significantly by employee level, tenure, and employment status. A full-time executive may have different benefits than a part-time contractor, and these differences must be reflected in workforce cost models. Finance should provide benefits data at the individual employee level, not just as departmental or company-wide averages, to enable accurate modeling of total rewards. Additionally, finance must communicate how benefits costs are allocated. Some organizations allocate benefits as a percentage of salary, while others use fixed per-employee amounts or tiered structures. Understanding the allocation methodology is critical for building accurate cost models. As outlined in total cost of the workforce best practices, comprehensive benefits data should include employer contributions to health, retirement, and welfare programs, as well as voluntary benefits that employees elect. For organizations using AI-powered HR analytics platforms, benefits data becomes even more valuable when combined with employee lifecycle data. This allows HR teams to model the cost impact of benefits changes, such as shifting from a defined benefit to a defined contribution retirement plan, or adjusting health insurance coverage levels. 3. Payroll Taxes and Statutory Contributions Payroll taxes and statutory contributions represent a significant but often overlooked component of total workforce cost. Finance must provide detailed data on all payroll tax obligations, including federal income tax withholding, Social Security, Medicare, unemployment insurance (federal and state), and any state or local income taxes. The complexity increases for organizations with employees across multiple states or countries. What makes this data field essential is that payroll taxes are non-discretionary costs that directly impact the total cost of employment. An employee with a $100,000 salary may have an additional 12-15% in payroll taxes, depending on location and compensation structure. Finance must provide the effective tax rates or actual tax amounts by employee, so that analytics teams can accurately model total compensation cost. For global organizations, this becomes even more complex. Different countries have different statutory contribution requirements, such as social security contributions, health insurance contributions, and pension contributions. Finance should provide a clear breakdown of these costs by country or region, enabling HR analytics teams to build accurate cost models for each geographic location. According to workforce cost forecasting guidance, payroll taxes should be calculated as a percentage of gross compensation and included in all workforce cost models. When building workforce planning strategies for global organizations, accurate payroll tax data is critical for comparing true employment costs across regions and making informed decisions about workforce allocation and expansion. 4. Overtime, Bonuses, and Variable Compensation Data While base salary provides a foundation, many organizations pay significant variable compensation in the form of overtime,

Read More

Agile HR Analytics v5.1

From Insight to Workforce Planning    While Version 5.0 focused on creating clarity through standardization, consistency, and data reliability, Agile HR Analytics v5.1 takes the next step in the platform’s evolution: helping organizations move from understanding the workforce to planning for its future.    This release introduces a new layer of workforce planning, scenario analysis, and forward-looking HR intelligence, enabling leaders to evaluate workforce risks, simulate future outcomes, and support more informed strategic decisions.  https://www.youtube.com/watch?v=k5JheATB_Gw Looking Beyond Today’s Workforce    Traditional HR analytics often focuses on what has happened and what is happening now. Version 5.1 expands that perspective by introducing dedicated workforce planning capabilities designed to help organizations answer questions such as:    What will our future headcount look like?  How might early employee exit affect workforce stability?  What is the cost impact of workforce growth or reduction scenarios?  Which roles may be most affected by emerging AI technologies?  How can internal mobility influence workforce planning decisions?    To solve these questions, a new Workforce Planning section has been introduced, creating a dedicated space for forward-looking analysis and strategic workforce decision-making.      Workforce Planning as a Connected Story    One of the key design goals of v5.1 was to transform workforce planning from a collection of isolated reports into a connected analytical narrative.    The new planning experience guides users through a structured journey:    Understanding the current workforce  Identifying workforce risks and movement patterns  Evaluating future workforce scenarios  Assessing financial implications  Exploring emerging workforce transformation opportunities    This executive-focused approach helps decision-makers move naturally from observation to action.      Understanding Early Exits Before They Become a Problem    Employee turnover within the first year of employment can have significant organizational and financial consequences.    Version 5.1 introduces a dedicated Early Exit Analysis experience, providing visibility of employee retention and workforce stability during the first twelve months of employment.    The new analytics include:    Retention and early-exit funnels  3, 6, 9, and 12-month exit analysis  Breakdown by Business Unit, Location, Job Level, and Gender  Identification of workforce segments with elevated early-exit risk    By highlighting workforce vulnerabilities earlier, organizations can better understand onboarding effectiveness, employee integration, and retention challenges.      Simulating Future Workforce Outcomes    Planning requires more than historical reporting; it requires the ability to evaluate potential futures.  Version 5.1 introduces several new projections and simulation capabilities:      Headcount Projection    Organizations can model scenarios for future workforce growth and reduction, assessing how workforce size may change over time.      Workforce Cost Projection    New projection models allow users to estimate workforce cost impacts through:    Job Level Cost Projections  Business Unit Cost Projections    These tools enable leaders to explore alternative workforce strategies while understanding their financial implications before decisions are implemented.      Early Exit Forecasting    A dedicated simulation model helps estimate how future early-exit trends could affect workforce capacity and organizational stability.    Together, these capabilities provide a stronger foundation for workforce planning conversations and resource allocation decisions.      Understanding Workforce Movement    People do not simply join and leave organizations; they move within them.    To provide greater visibility into workforce dynamics, Version 5.1 introduces a new Job Mobility Analysis section.    This capability helps organizations understand:    Internal role movement  Career progression patterns  Workforce flow between organizational areas  Talent mobility trends    By analyzing internal movement, organizations can better evaluate talent development strategies and identify opportunities to strengthen retention through career growth.      Preparing for the AI-Driven Workforce    As organizations increasingly evaluate the impact of artificial intelligence on work, workforce planning must evolve accordingly.    Version 5.1 introduces a new AI Impact Analysis section designed to support early discussions around:   Workforce automation opportunities  Role augmentation scenarios  Job redesign considerations  Workforce transformation planning    Rather than focusing solely on technology, this analysis helps organizations explore how AI may influence workforce structures, job groups, and future talent requirements.  This represents an important step toward building AI-ready workforce planning capabilities.      Building Trust Through Data Quality Transparency    Advanced analytics are only valuable when users trust the underlying data.    To strengthen transparency and confidence, Version 5.1 introduces dedicated Data Quality pages across key dashboard sections.    These pages provide visibility into:    Data completeness  Data consistency  Validation results  Analysis readiness indicators    By surfacing data quality directly within the analytical experience, users can better understand the reliability of the insights they are consuming.  Trust is no longer assumed; it is visible.      Making the Data Model Easier to Understand    Version 5.1 also expands the platform’s internal HR Dictionary, transforming it into a more comprehensive technical reference.    Beyond measures and business definitions, users can now explore:  Tables  Columns  Relationships  Star Schema structures  Data model components    This enhancement improves transparency for analysts, developers, and administrators while supporting governance and knowledge sharing across teams.      A Foundation for Smarter Workforce Decisions    Version 5.1 is more than a collection of new reports.    It represents a shift from descriptive HR analytics toward workforce intelligence, where organizations can evaluate risks, model future outcomes, understand workforce movement, and prepare for emerging workforce transformation.    By combining planning, simulation, transparency, and data confidence within a unified experience, Agile HR Analytics continues its evolution from a reporting platform into a strategic workforce decision-support solution.      Looking Ahead    The journey toward intelligent workforce planning continues.    Future roadmap initiatives include:    More advanced forecasting and simulation models  Enhanced workforce planning assumptions and scenario configuration  Expanded AI impact assessments across roles and skills  Automated anomaly detection and data quality monitoring  Deeper predictive analytics for retention, workforce cost, and organizational planning    The future of HR analytics is not only about understanding the workforce.  It is about understanding what comes next and being prepared for it.   

Read More

AI Workforce Intelligence for the Public Sector: Bridging HR and IT with Microsoft

Public sector organisations are experiencing a major shift in how they manage, understand, and act on workforce data. As workforce pressures intensify and digital transformation accelerates, HR and IT teams are being pushed into closer collaboration than ever before. Both functions are now expected to improve workforce visibility, reduce reporting complexity, modernise legacy analytics environments, accelerate decision making, and maximise existing Microsoft investments. Yet most workforce analytics environments were built for reporting, not operational execution. Why Public Sector Organisations Are Reassessing Workforce Analytics Workforce intelligence has evolved from a back-office reporting function into a strategic capability that affects the entire organisation. HR teams are under pressure to improve workforce planning, retention visibility, recruitment forecasting, and operational responsiveness. At the same time, IT teams are increasingly involved because workforce intelligence now touches governance, security, infrastructure, integration, and AI strategy. This creates tension. HR wants faster answers and more agility. IT wants governance, security, and reduced platform sprawl. Traditional dashboard centric analytics environments often sit awkwardly between these two priorities. They introduce additional SaaS platforms, new integrations, more governance overhead, and higher operating costs. As a result, public sector organisations are looking for a new model that supports both agility and control. Bridging HR and IT Through Microsoft The public sector does not need another disconnected analytics platform. What it needs is workforce intelligence that fits naturally within its existing enterprise technology strategy. This is where Microsoft becomes a powerful unifying force. Most public sector organisations already operate within Azure, Fabric, Power BI, and Microsoft’s security frameworks. Aha! extends these investments rather than adding a new standalone environment. This alignment gives HR faster insights, self service capability, AI driven answers, and improved operational visibility. IT benefits from existing governance, existing security controls, reduced SaaS sprawl, and lower operational complexity. Instead of being an HR procurement conversation, workforce intelligence becomes a shared transformation initiative. Moving Beyond Dashboards Dashboards were an important first step in workforce analytics, but they still rely heavily on analysts, interpretation, reporting cycles, and manual explanation. In the public sector, this creates bottlenecks and slows down decision making. Leaders today want immediate answers, real time visibility, and simple access to insights. They no longer want to request a report or wait for an analyst to interpret a dashboard. They want to ask questions such as: Where are we seeing workforce pressure Where is attrition risk increasing Which units are struggling with recruitment Where is overtime rising What might impact service delivery And they expect instant, AI generated responses that highlight risks and recommend actions. This is the shift toward AI Agent First Workforce Intelligence. The Rise of Self-Service Workforce Intelligence Analytics teams across the public sector are stretched thin. The challenge is no longer just producing reports but enabling the entire organisation to access and use workforce intelligence. Self-service models allow executives, HR leaders, operational leaders, and department managers to interact directly with insights. This reduces reporting dependency, lowers manual workload, and speeds up decision making. Most importantly, it increases adoption. People engage more naturally with conversational questions and answers than with complex dashboards. Why Microsoft Alignment Matters Public sector organisations face ongoing pressure to rationalise technology, reduce complexity, improve governance, and maximise existing investments. Aha! is built entirely within Azure, Fabric, Power BI, and Azure OpenAI, which means no net new SaaS platform and no movement of workforce data outside the organisation’s tenant. This significantly reduces procurement friction, security reviews, and long-term operating costs. It also ensures HR and IT are working from the same technology strategy, which is becoming a major differentiator in the market. The Future of Workforce Intelligence The future of public sector workforce intelligence is not more dashboards or more reporting. It is AI enabled operational decision making. Organisations that move early will benefit from faster workforce decisions, AI assisted insight delivery, self-service operating models, and secure enterprise-wide intelligence capability. This leads to better workforce visibility, improved operational responsiveness, lower technology overhead, stronger HR and IT alignment, and ultimately better service delivery outcomes. See It in Action Watch our full webinar, which includes a demonstration of our platform, showing exactly how AI agent driven workforce intelligence works in practice and what moving beyond dashboards truly looks like. For organisations exploring this journey, Aha! offers tailored demonstrations, public sector use case deep dives, alignment to Microsoft strategy, and low risk proof of concept pathways. The shift is already underway. The question is which organisations will lead it.

Read More

Moving Beyond Dashboards: How AI Agents Are Redefining Workforce Intelligence

Most organizations don’t have a workforce data problem. They have an access-to-insight problem. Every day, HR leaders are asked critical questions: Where are we losing key talent? Which teams are at highest attrition risk? Is hiring keeping up with business demand? Where are workforce gaps impacting productivity? Yet in most organizations, answering those questions still requires analysts pulling reports, manipulating dashboards, and manually translating data into recommendations. By the time the answer arrives, the decision window has often already passed. This is the quiet limitation of the traditional dashboard model, not a technology failure, but an operational one. Dashboards Were Built for Reporting – Not Decision-Making For years, workforce analytics has centered around dashboards. Build a visualization. Share a report. Create filters. Publish another page. But dashboards still require interpretation. Business leaders rarely want to navigate layers of reporting logic or wait for analysts to explain what the charts actually mean. The result is a familiar cycle: A leader asks a question HR or analytics teams build a report Data gets translated into a narrative Recommendations arrive hours or days later That delay creates friction between the business question and the business action. The issue isn’t the quality of the data. The issue is the interface between people and insight.     The Hidden Cost of Traditional People Analytics Platforms When organizations realize dashboards aren’t delivering enough value, the default response is often to purchase another workforce analytics platform. And while many traditional vendors provide strong reporting capabilities, they also introduce new challenges: Data duplication across environments Additional governance and security complexity Long implementation timelines Ongoing licensing costs Another SaaS platform for IT to manage Low long-term adoption outside analytics teams More organizations are now asking a different question: Why invest in another external platform when the infrastructure already exists internally? Your Microsoft Ecosystem Already Has the Foundation Most mid-to-large enterprises already operate on a powerful data foundation: Microsoft Azure Microsoft Fabric Power BI Enterprise data lakes Existing governance and security frameworks What’s often missing isn’t more dashboards. It’s an intelligence layer that can interpret workforce data in real time. Instead of: Buying another platform → moving data → building reports Organizations are shifting toward: Activating existing workforce data → leveraging AI agents → receiving immediate answers This changes the economics of workforce intelligence entirely. IT retains governance and control HR gains immediate access to insights CFOs avoid unnecessary platform spend Business leaders move faster And critically – the data never has to leave the organization’s existing environment.     From Dashboards to Answers The real transformation is not visual. It’s conversational. Instead of opening a dashboard and applying filters, leaders simply ask: “Where are our biggest workforce risks?” “Which business units are struggling with retention?” “Are promotions keeping pace with growth?” “What regions are under-resourced?” An AI agent interprets the request, scans workforce data in real time, identifies patterns and anomalies, and returns structured insights instantly. Not just metrics. Direction. The interface becomes the conversation itself.   Why This Matters to Both HR and IT Historically, workforce analytics has forced a compromise between HR and IT. HR wanted speed and accessibility. IT wanted governance and control. Modern AI-driven workforce intelligence allows organizations to achieve both simultaneously. Because analytics operates within the existing Microsoft environment: IT maintains security, permissions, and governance HR gains direct access to actionable insights Data remains inside the tenant Existing investments in Fabric, Power BI, and Azure are fully leveraged This is no longer about replacing dashboards. It’s about extending enterprise intelligence. The Organizations Winning with AI Aren’t Buying More Tools They’re activating the infrastructure they already own. The future of workforce intelligence is not another reporting layer. It’s an AI-powered system of insight that connects workforce data to operational and business outcomes in real time. The organizations moving fastest are doing so because: Decision-making accelerates Analyst dependency decreases Adoption improves Time-to-insight collapses Cost structures improve dramatically Most importantly, leaders stop waiting for reports – and start acting on insight immediately. Ready to Move Beyond Dashboards? If your organization is already invested in Microsoft and looking to modernize workforce intelligence without introducing another SaaS platform, now is the time to rethink the model. At Aha!, we help organizations move from static dashboards to AI-driven workforce intelligence,  leveraging AI agents inside your existing Microsoft ecosystem to deliver immediate, actionable insights. What this means for your organization: Faster workforce decisions AI-driven insights in seconds Reduced dependency on manual reporting Enterprise-grade governance and security A fraction of the cost of traditional vendors No need to increase analytics headcount If you’d like to see what this looks like in practice, book a personalized demo directly with me and explore how organizations are transforming workforce analytics with AI. Book a demo today and see how Aha! is helping enterprises move from dashboards to answers.

Read More
Deploy an Attrition Model Monitoring and Drift Detection Pipeline in Azure

Deploy an Attrition Model Monitoring and Drift Detection Pipeline in Azure

Introduction Enterprise HR organizations face a critical challenge: predictive attrition models that perform well in development often degrade in production environments. Data drift, concept drift, and changing workforce dynamics can silently erode model accuracy, leading to flawed talent retention decisions and missed opportunities to prevent key employee departures. This comprehensive tutorial walks you through deploying a production-grade attrition model monitoring and drift detection pipeline in Microsoft Azure, integrated with Agile HR Analytics’ AI-powered insights platform. By the end of this guide, you’ll have a fully automated system that continuously monitors your attrition predictions, detects performance degradation, and triggers retraining workflows, ensuring your HR analytics remain accurate and actionable. Whether you’re a data engineer building the infrastructure, an HR analytics leader overseeing implementation, or a CHRO evaluating enterprise HR analytics solutions, this step-by-step walkthrough covers everything from prerequisites through production deployment and troubleshooting. Prerequisites and Environment Setup Before you begin, ensure you have the following components in place: Azure Subscription and Services An active Azure subscription with sufficient quota for Azure Machine Learning, Azure Data Factory, Azure Storage, and Azure Synapse Analytics Owner or Contributor role permissions to create and manage resources Azure CLI installed and configured on your local machine (version 2.40 or later) Azure Storage account for data ingestion, model artifacts, and monitoring logs HR Data and Infrastructure HR, payroll, and survey data sources accessible via API or database connections (Workday, SuccessFactors, SAP, or custom HRIS systems) Historical attrition labels (employee departure records) spanning at least 12 months Employee features including tenure, compensation, department, engagement scores, and performance ratings Understanding of your data governance and privacy requirements, especially if operating in regulated industries requiring GDPR or CCPA compliance Development Tools and Libraries Python 3.9 or later with pip package manager Jupyter Notebook or VS Code for development Git for version control Key Python libraries: pandas, scikit-learn, Azure SDK for Python, TensorFlow or XGBoost for model development Microsoft Stack Components Azure Machine Learning workspace configured for model training and inference Azure DevOps or GitHub for CI/CD pipeline automation Power BI Premium capacity for dashboard visualization (optional but recommended for stakeholder reporting) Azure OpenAI integration for XAHA AI assistant integration (optional for advanced insights) Before proceeding, verify connectivity to your HR data sources and confirm that you can successfully authenticate to Azure services. Document your data schema, including field names, data types, and update frequencies,this information becomes critical when configuring monitoring thresholds. Understanding Attrition Model Drift and Monitoring Concepts Production ML systems face three primary failure modes that directly impact HR decision-making: Data Drift Data drift occurs when the statistical distribution of input features changes over time. In HR contexts, this might manifest as shifts in workforce composition (more remote workers, different geographic distribution), changes in compensation structures, or evolving engagement patterns. For example, if your training data included primarily office-based employees but your production data increasingly contains remote workers, the feature distributions diverge, potentially degrading model performance. Concept Drift Concept drift represents changes in the relationship between features and the target variable (attrition). This occurs when the underlying business dynamics shift—for instance, if a company implements a new retention bonus program, the relationship between compensation and attrition changes. Historical patterns no longer predict future outcomes accurately. Prediction Drift Prediction drift manifests as changes in model output distributions. If your model historically predicted 8% attrition risk across the workforce but suddenly predicts 15% risk, this shift signals either data drift, concept drift, or model degradation. Monitoring prediction drift helps identify when retraining is necessary. Understanding these concepts is essential because they determine your monitoring strategy. As detailed in resources on reliable production ML pipelines covering best practices and monitoring tools, effective monitoring requires tracking multiple dimensions simultaneously rather than relying on single metrics. When implementing data pipeline monitoring with tools and best practices, you’ll want to establish baseline metrics from your training data, then continuously compare production data against these baselines. This approach enables early detection of degradation before it impacts HR decision-making. Step 1: Prepare and Validate Your HR Data Data quality directly determines monitoring effectiveness. Begin by extracting your complete HR dataset from source systems. Extract and Consolidate Data Create a Python script to extract data from your HR systems: import pandas as pd from azure.storage.blob import BlobServiceClient from azure.identity import DefaultAzureCredential import logging logging.basicConfig(level=logging.INFO) logger = logging.getLogger(__name__) # Configure Azure Storage connection_string = “your_storage_connection_string” blob_service_client = BlobServiceClient.from_connection_string(connection_string) container_client = blob_service_client.get_container_client(“hr-data”) # Extract HR data from source system def extract_hr_data(query): “”” Extract HR data from your HRIS system. Replace with your actual data source connection. “”” # Example: Connect to Workday, SuccessFactors, or custom database df = pd.read_sql(query, connection_string) return df # Define required features for attrition modeling required_features = [ ’employee_id’, ‘tenure_months’, ‘salary’, ‘department’, ‘job_level’, ‘engagement_score’, ‘performance_rating’, ‘promotion_eligible’, ‘attrition_flag’ # Target variable ] # Extract data hr_data = extract_hr_data(“SELECT * FROM employees WHERE active = 1″) logger.info(f”Extracted {len(hr_data)} employee records”) # Validate required columns missing_cols = set(required_features) – set(hr_data.columns) if missing_cols: raise ValueError(f”Missing required columns: {missing_cols}”) logger.info(“All required columns present”) Implement Data Quality Checks Establish baseline data quality metrics that will guide your monitoring thresholds: import numpy as np def validate_data_quality(df, quality_thresholds): “”” Validate HR data quality against established thresholds. Returns quality report and flags any anomalies. “”” quality_report = {} # Check for missing values missing_pct = (df.isnull().sum() / len(df) * 100).to_dict() quality_report[‘missing_values’] = missing_pct # Validate missing value thresholds for col, threshold in quality_thresholds[‘max_missing_pct’].items(): if missing_pct.get(col, 0) > threshold: logger.warning(f”Column {col} has {missing_pct[col]:.2f}% missing values”) # Check for outliers in numeric columns numeric_cols = df.select_dtypes(include=[np.number]).columns outlier_stats = {} for col in numeric_cols: q1 = df[col].quantile(0.25) q3 = df[col].quantile(0.75) iqr = q3 – q1 outliers = df[(df[col] < q1 – 1.5*iqr) | (df[col] > q3 + 1.5*iqr)] outlier_stats[col] = len(outliers) / len(df) * 100 quality_report[‘outlier_percentages’] = outlier_stats # Check target variable balance attrition_rate = df[‘attrition_flag’].mean() quality_report[‘attrition_rate’] = attrition_rate logger.info(f”Baseline attrition rate: {attrition_rate:.2%}”) return quality_report # Define quality thresholds quality_thresholds = { ‘max_missing_pct’: { ‘tenure_months’: 1, ‘salary’: 0.5, ‘engagement_score’: 5, ‘performance_rating’: 2 } } quality_report = validate_data_quality(hr_data, quality_thresholds) print(“Data

Read More
6 Pre-Built Power BI DAX Measures in Agile HR Analytics for Global Headcount Reconciliation

6 Pre-Built Power BI DAX Measures in Agile HR Analytics for Global Headcount Reconciliation

Why Global Headcount Reconciliation Matters for Enterprise HR Leaders Global headcount reconciliation is one of the most critical yet challenging tasks for enterprise HR leaders, particularly those managing organizations across multiple regions, business units, and payroll systems. When you’re operating at scale, with teams spread across North America, Europe, Asia Pacific, and beyond, maintaining an accurate, real-time view of your total workforce becomes exponentially more complex. Headcount data flows from multiple sources: your HRIS system, payroll platforms, time and attendance systems, survey tools, and business data warehouses. Each system operates on different calendars, uses different employee identifiers, and applies different business rules for who counts as “active” on any given date. Without a unified, reconciled view, CHROs and people analytics teams face critical blind spots that can impact workforce planning, compensation decisions, compliance reporting, and strategic talent decisions. This is where pre-built Power BI DAX measures become invaluable. Rather than building headcount calculations from scratch, organizations can leverage proven, battle-tested formulas that handle the complexity of multi-source data, time-based calculations, and business rule variations. Agile HR Analytics delivers six essential Power BI DAX measures specifically designed for global headcount reconciliation, built on the Microsoft stack and ready for rapid deployment. These measures aren’t just technical formulas; they’re strategic assets that enable CHROs to make faster, more confident decisions about workforce composition, capacity planning, and organizational health. By automating headcount calculations with DAX, HR teams can shift from manual spreadsheet reconciliation to real-time analytics dashboards that update automatically as source data changes. In this article, we’ll explore each of these six pre-built measures in detail, explain how they work, and show you how they integrate into a comprehensive HR analytics strategy. Whether you’re evaluating enterprise HR analytics solutions or looking to enhance your existing Power BI implementation, these measures provide a foundation for accurate, actionable workforce insights. 1. Point-in-Time Headcount (Snapshot Measure) The Point-in-Time Headcount measure is the foundational building block for all headcount reconciliation. This measure calculates the total number of active employees at a specific date, considering hire dates, termination dates, and leave periods. Unlike simple row counts, this DAX measure applies business logic to determine who should be counted as “active” on any given day. For global organizations, this measure is critical because it must account for employees at different stages of their employment lifecycle. An employee hired on January 15 shouldn’t be counted in January 1 snapshots. Similarly, an employee who terminated on June 30 shouldn’t appear in July headcount reports. The measure also handles leaves of absence, sabbaticals, and other employment status variations that differ by region and company policy. The Point-in-Time Headcount measure uses DAX logic that evaluates hire dates, termination dates, and employment status flags against a selected date. According to Optimizing HR Head Count DAX Measure with Power BI, this approach requires careful attention to date logic and performance optimization, particularly when working with large employee datasets across multiple regions. What makes this measure powerful in Agile HR Analytics is that it’s pre-built and pre-optimized. Rather than writing complex DAX from scratch, your team can immediately apply this measure to your integrated HR data model. The measure works seamlessly whether you’re pulling data from SAP SuccessFactors, Workday, ADP, or other enterprise HRIS platforms that have been integrated into your HR data integration architecture. This measure becomes the baseline for all downstream analytics. Every other headcount-related calculation, from attrition rates to organizational structure analysis, depends on having an accurate point-in-time headcount. When this foundation is solid, the entire analytics house stands firm. 2. Beginning of Period Headcount (BOP) The Beginning of Period Headcount measure calculates the number of active employees at the start of a specific period—typically a month, quarter, or year. This measure is essential for period-over-period workforce planning analysis and for reconciling headcount changes within defined business periods. Why is BOP headcount distinct from point-in-time headcount? Because business reporting typically works within period boundaries. When a CFO asks “what was our headcount at the start of Q3,” they want to know the exact count at the beginning of that quarter, not a rolling average or a mid-period snapshot. The BOP measure ensures consistent period-based reporting that aligns with financial reporting, budget planning, and organizational reviews. In global organizations, BOP headcount takes on additional complexity. Different regions may operate on different fiscal calendars. Some business units might use calendar months, while others use 4-5-4 retail calendars or other custom period structures. The pre-built BOP measure in Agile HR Analytics accommodates these variations, applying the correct period definition based on your organization’s calendar configuration. The measure integrates with your date dimension table, which should include period start and end dates for all relevant calendar structures. This allows your Power BI dashboards to automatically adjust BOP calculations based on the selected period, without requiring manual formula adjustments. According to Headcount Calculation in DAX – SQLBI, this pattern is one of the most important foundations for reliable HR analytics, as it ensures consistency across all period-based reporting. When combined with other measures, BOP headcount enables powerful workforce planning analytics. You can calculate headcount growth rates, analyze seasonal hiring patterns, and forecast future staffing needs with confidence. 3. End of Period Headcount (EOP) The End of Period Headcount measure complements BOP by calculating active employees at the conclusion of a specific period. Together, BOP and EOP measures enable period-over-period change analysis, which is essential for understanding workforce dynamics and validating headcount reconciliation across your organization. EOP headcount answers the question: “How many employees did we have at the end of this month/quarter/year?” This measure is critical for period-end reporting, financial reconciliation, and compliance documentation. Many regulated industries require precise headcount documentation at period ends for regulatory filings, benefit plan accounting, and payroll reconciliation. The EOP measure handles the complexity of employees who hire or terminate on the last day of a period. Business rules matter here: does an employee hired on the last day of the month count in that month’s EOP? Does an employee who terminates on the

Read More

Why HR Still Can’t Answer the Most Important Question: “What’s Happening in Our Workforce Right Now?”

HR has more data than ever.More dashboards.More reports.   And yet, when a CHRO is asked a simple question in a leadership meeting— “Where are our workforce risks right now?” —there’s still a pause. Because the real answer is: “We’ll need a few days.” https://youtu.be/rr5MQ9Xx-Ew This Isn’t a Data Problem. It’s a Decision Problem.   Every modern HR team already has the data to answer critical business questions: Where is attrition building before it spikes? Which teams are under capacity right now? Where are we over- or under-hiring against demand?   The issue isn’t access.It’s time, friction, and dependency.   To answer even one question, teams still need to: Pull from multiple dashboards Reconcile inconsistent data Translate HR metrics into business context Package it into something leadership can use   That takes days.The business moves in hours.   So decisions get made without the full picture. Dashboards Didn’t Solve the Problem—They Shifted It   Dashboards gave HR visibility. But they didn’t give HR speed.They didn’t give HR clarity.They didn’t give HR direct access to answers.   Instead, they created a new bottleneck: People Analytics becomes the gatekeeper HRBPs become reactive instead of proactive CHROs walk into meetings without real-time insight   The result: Repeated report requests Delayed decisions Underutilized data Missed early warning signals   The Cost Is Bigger Than It Looks   This isn’t just inefficiency. It’s risk.   Attrition trends are identified too late Hiring gaps impact delivery and revenue Workforce planning becomes reactive Leadership loses confidence in HR’s ability to lead with data   HR doesn’t lack insight. It lacks the ability to deliver it in the moment it matters.   What AHA! with XAHA Changes   AHA! with XAHA removes the bottleneck. Instead of requesting reports, waiting on analysis, and translating dashboards—you simply ask a question. And get a clear answer. Instantly.   From Dashboards to Answers   With XAHA, AHA!’s AI workforce agent: A CHRO can ask where workforce risks exist by region and get a structured answer in seconds An HRBP can identify early attrition signals before they become a problem A People Analytics team can shift from repeat reporting to high-value strategic work   What This Means for the Business   Answers in seconds, not days Clear, business-ready outputs instead of raw data No dependency on analysts for every request Real-time confidence in workforce decisions   Built for Enterprise Reality   XAHA operates within your existing environment: Connects across HR systems Normalizes and governs workforce data Runs securely within your Microsoft ecosystem Same data.Completely different outcome.   The Shift   When HR can answer questions instantly: Leadership stops waiting Conversations become proactive Decisions become truly data-driven Less time explaining the data.More time influencing the business.   The Bottom Line You don’t need more dashboards.You don’t need more reports. You need answers—when the business asks the question.   See It in Action   Book a demo today and experience how AHA! with XAHA turns your workforce data into real-time, decision-ready intelligence.

Read More
10 People Analytics Metrics Every CHRO Should Track

10 People Analytics Metrics Every CHRO Should Track

Introduction: Why People Analytics Metrics Matter for CHROs In today’s competitive talent landscape, Chief Human Resources Officers (CHROs) face unprecedented pressure to demonstrate HR’s strategic value and impact on the bottom line. Gone are the days when HR decisions could be made on intuition alone. Modern organizations demand evidence-based insights that connect workforce data to business outcomes. This is where people analytics metrics become indispensable. People analytics metrics transform raw HR data into actionable intelligence that drives smarter talent decisions. Whether you’re managing succession planning, optimizing compensation strategies, reducing unwanted attrition, or building a more diverse and inclusive workforce, the right metrics provide the visibility you need. According to The Ultimate Guide to People Analytics Metrics, CHROs who leverage key performance indicators like turnover rate, retention rate, and time-to-hire gain significant competitive advantages in attracting and retaining top talent. The challenge, however, is knowing which metrics matter most. With hundreds of potential HR indicators available, it’s easy to get lost in vanity metrics that don’t drive real business impact. That’s why we’ve compiled this comprehensive guide to the 10 people analytics metrics every CHRO should be tracking. These metrics span talent acquisition, employee engagement, retention, compensation equity, and workforce planning the pillars of strategic HR management. By implementing these metrics into your HR analytics strategy, you’ll gain clarity on workforce performance, identify hidden risks before they become crises, and make data-informed decisions that align talent strategy with business objectives. Platforms like Agile HR Analytics provide CHROs with AI-powered dashboards and pre-built data models that make tracking these metrics seamless and actionable, enabling rapid deployment of insights across your organization. Let’s explore each of these critical people analytics metrics in detail. 1. Employee Turnover Rate: Understanding Your Workforce Stability Employee turnover rate is perhaps the most fundamental people analytics metric, yet many organizations fail to track it effectively. This metric measures the percentage of employees who leave your organization during a specific period, typically calculated as (Number of Separations / Average Number of Employees) × 100. Why does turnover matter so much? The cost of replacing an employee can range from 50% to 200% of their annual salary when you factor in recruitment, onboarding, lost productivity, and knowledge transfer. High turnover disrupts team dynamics, damages institutional knowledge, and signals deeper organizational problems. Conversely, abnormally low turnover might indicate stagnation or lack of career growth opportunities. According to CHRO’s Handbook: Top 5 Metrics for 2024, forward-thinking CHROs are monitoring turnover not just at the organizational level but by department, tenure, performance level, and demographic group. This granular approach reveals which teams or populations are experiencing disproportionate attrition and why. The real power of tracking turnover emerges when you segment the data. Are your highest performers leaving? Is turnover concentrated in specific departments or regions? Are certain demographics experiencing higher exit rates, suggesting potential DEI&B concerns? By connecting turnover data with exit interview feedback, performance ratings, and compensation data, you can identify the root causes and take targeted action. Modern HR analytics platforms enable CHROs to set turnover benchmarks against industry standards, predict which employees are at highest risk of departure, and simulate the financial impact of different retention interventions. With tools like Agile HR Analytics, you can build interactive dashboards that track turnover trends in real time, alerting you to concerning spikes before they escalate into larger problems. 2. Time-to-Hire: Measuring Recruitment Efficiency Time-to-hire measures the number of days between when a job requisition is opened and when a candidate accepts the offer. This metric directly impacts your ability to fill critical roles quickly and maintain competitive advantage in talent markets. A lengthy time-to-hire increases the risk of losing top candidates to competitors, extends the period when teams operate below capacity, and inflates recruitment costs. According to The Ultimate Guide to People Analytics Metrics, organizations that optimize time-to-hire see significant improvements in team productivity and employee satisfaction. The benchmark varies by role and industry, but most organizations aim for 30-45 days from posting to acceptance. However, time-to-hire is only one dimension of recruitment efficiency. CHROs should also track related metrics like time-to-fill (days from posting to start date), cost-per-hire, and quality-of-hire. Quality-of-hire measures how well new employees perform and retain, revealing whether speed is coming at the expense of candidate quality. To optimize time-to-hire, analyze where delays occur in your recruitment process. Are candidates taking too long to apply? Is your screening process inefficient? Are hiring managers slow to interview? Is there friction in the offer negotiation phase? By breaking down time-to-hire into process stages, you can identify bottlenecks and implement targeted improvements. Data integration is crucial here. Connect your applicant tracking system (ATS) data with onboarding and performance data to understand whether faster hiring correlates with better long-term outcomes. Some organizations find that investing slightly more time in the hiring process yields better cultural fit and retention, while others discover that their lengthy process is unnecessarily filtering out strong candidates. 3. Employee Retention Rate: The Flip Side of Turnover While turnover rate measures who’s leaving, retention rate measures who’s staying. Calculated as (Number of Employees at End of Period / Number of Employees at Beginning of Period) × 100, retention rate provides a positive framing of workforce stability and is often more meaningful for strategic planning. Retention rate becomes particularly important when analyzed by cohort. 7 Secrets Every CHRO Should Know About People Analytics emphasizes that understanding retention patterns across different employee populations reveals which groups are most at risk and which are most committed to the organization. Key retention cohorts to track include: Tenure-based retention: How many employees stay through their first year, second year, and beyond? High first-year attrition suggests onboarding or role-fit issues. Performance-based retention: Are your highest performers staying or leaving? Losing top talent is particularly costly. Role-based retention: Some positions naturally have higher turnover; understanding the variation helps set realistic targets. Demographic retention: Track retention by age, gender, race, and other dimensions to identify equity issues. Manager-based retention: Do certain managers have significantly better or worse retention? This reveals management effectiveness.

Read More
The Ultimate Guide to Workforce Planning for Regulated Enterprises

The Ultimate Guide to Workforce Planning for Regulated Enterprises

Introduction to Workforce Planning for Regulated Enterprises Workforce planning is no longer a peripheral HR function it’s a strategic imperative that directly impacts organizational performance, compliance, and competitive advantage. For regulated enterprises operating in industries such as healthcare, finance, energy, and government, workforce planning takes on heightened complexity. These organizations must balance ambitious business growth with stringent regulatory requirements, data privacy obligations, and evolving labor market dynamics. Use this workforce planning guide as a practical reference to build or improve your program. This workforce planning guide emphasizes compliance and analytics as pillars of a defensible approach. The stakes are high. Poor workforce planning leads to talent shortages, compliance violations, increased turnover, and missed business opportunities. Conversely, organizations that excel at workforce planning achieve better talent utilization, lower attrition rates, stronger regulatory standing, and improved financial performance. This comprehensive guide is designed for CHROs, HR analytics leaders, people operations teams, and IT/data professionals at enterprise organizations. Whether you’re building a workforce planning capability from scratch or optimizing an existing program, this guide provides actionable frameworks, best practices, and insights into leveraging modern analytics platforms to turn workforce data into strategic decisions. Throughout this guide, we’ll explore how regulated enterprises can implement effective workforce planning while maintaining compliance, security, and privacy and how AI-powered HR analytics solutions can accelerate your journey. Consider this workforce planning guide a roadmap you can adapt to your organization’s size, industry, and regulatory requirements. Understanding the Workforce Planning Framework What Is Workforce Planning? Workforce planning is a systematic process of analyzing an organization’s current workforce capabilities and future talent needs, then developing strategies to close the gap. According to the U.S. Office of Personnel Management’s workforce planning guide, effective workforce planning follows a five-step model: establishing strategic direction, analyzing the current workforce, developing action plans, implementing those plans, and continuously evaluating results. This workforce planning guide explains the five-step model and how to apply it in regulated contexts. For regulated enterprises, workforce planning extends beyond headcount forecasting. It encompasses talent quality assessment, skills inventory management, succession planning, regulatory compliance tracking, and alignment with organizational mission and operational needs. The Core Components of Workforce Planning A robust workforce planning program integrates multiple interconnected components: Strategic Workforce Analysis involves understanding your organization’s business strategy and translating it into workforce requirements. This includes identifying critical roles, required competencies, and future talent needs aligned with business objectives. Current State Assessment requires a comprehensive inventory of your existing workforce headcount by function, skill levels, demographics, tenure, performance, and retention risk. For regulated enterprises, this assessment must also capture compliance certifications, security clearances, and other regulatory qualifications. Demand Forecasting projects future workforce needs based on business growth plans, market expansion, technology adoption, and regulatory changes. Advanced analytics can help predict demand with greater accuracy. Gap Analysis identifies the difference between current workforce capabilities and future requirements. These gaps may be quantitative (insufficient headcount) or qualitative (missing skills, experience, or credentials). Action Planning develops specific strategies to address identified gaps through recruitment, development, retention, or organizational restructuring. Refer to this workforce planning guide when defining action plans and monitoring implementation. Implementation and Monitoring executes the action plan while tracking progress against workforce metrics and adjusting strategies as business conditions change. According to AIHR’s strategic workforce planning guide, organizations that implement these components systematically achieve better talent outcomes and stronger alignment between workforce capabilities and business strategy. Why Workforce Planning Matters for Regulated Enterprises Regulated enterprises face unique workforce planning challenges. Compliance requirements often mandate specific staffing levels, certifications, and background checks. Data privacy regulations like GDPR and CCPA impose constraints on how workforce data can be collected, stored, and analyzed. Industry standards in healthcare (HIPAA), finance (SOX), and energy (NERC) create additional complexity. Yet these same constraints also create opportunity. Organizations that master workforce planning within a regulatory framework gain competitive advantage. They reduce compliance risk, improve talent quality, lower turnover costs, and make faster, more informed decisions. Compliance and Regulatory Considerations Navigating the Regulatory Landscape Workforce planning in regulated industries must account for multiple overlapping regulatory frameworks. The Workforce Planning Resource Guide for Public Sector Human Resources from IPMA outlines how public sector organizations must align workforce planning with statutory requirements, budget constraints, and civil service rules. For private sector regulated enterprises, compliance considerations include: Labor and Employment Laws govern hiring practices, compensation equity, reasonable accommodations, and anti-discrimination requirements. Workforce planning must ensure sufficient resources to maintain compliance. Industry-Specific Regulations impose staffing ratios, certification requirements, and competency standards. Healthcare organizations, for example, must maintain nurse-to-patient ratios; financial institutions must have sufficient compliance officers; energy companies must maintain certified operators. Data Privacy and Security regulations like GDPR, CCPA, and HIPAA constrain how workforce data can be collected, processed, and shared. Workforce planning systems must ensure data governance, role-based access controls, and audit trails. Succession Planning and Continuity requirements, particularly in critical infrastructure industries, mandate planning for key personnel transitions and disaster recovery. A dedicated workforce planning guide helps map regulatory requirements to staffing and certification plans. This workforce planning guide highlights data privacy practices crucial for regulated enterprises. Building Compliance into Workforce Planning Effective compliance-conscious workforce planning incorporates regulatory requirements into every stage: During Strategic Planning, identify regulatory constraints and opportunities. For example, if your industry requires specific certifications, your workforce planning must account for the time and cost of obtaining those certifications. In Current State Assessment, track compliance-relevant data: certifications, clearances, training completion, audit findings, and regulatory violations. This data reveals compliance risk and informs future staffing decisions. In Demand Forecasting, model regulatory change scenarios. If a new regulation will require additional compliance staff, your demand forecast should reflect that impact. In Gap Analysis, assess both capability gaps and compliance gaps. You may have sufficient headcount but lack required certifications or diversity representation. In Action Planning, develop strategies that address both business and compliance needs. Training programs should include compliance-required coursework; recruitment should target candidates with necessary credentials. The California DCA’s Workforce and Succession Plan demonstrates how government organizations integrate succession planning, recruitment, and retention strategies while maintaining compliance with civil service laws and budget requirements. Data

Read More
Pay Equity Analytics Case Study: How a Global Employer Fixed Gaps Fast

Pay Equity Analytics Case Study: How a Global Employer Fixed Gaps Fast

The Challenge: Hidden Pay Gaps in a Global Organization A multinational technology company with over 15,000 employees across 12 countries faced a critical business and ethical challenge. Despite having a strong commitment to diversity, equity, and inclusion (DEI) initiatives, the organization had no systematic way to identify or monitor pay equity across its global workforce. HR leaders suspected compensation gaps existed particularly across gender, ethnicity, and tenure but lacked the data visibility to quantify the problem or take action. The company’s compensation data was scattered across multiple systems: their core HRIS held employee records and salary information, their payroll platform contained detailed compensation details, and employee engagement surveys provided demographic and sentiment data. These systems didn’t communicate with one another, making comprehensive pay equity analysis nearly impossible. When the Chief Human Resources Officer (CHRO) commissioned an audit, the HR analytics team faced a daunting task: manually extracting data from five different sources, cleaning inconsistencies, and building analysis from scratch a process that would take months. Beyond the operational challenge, the organization faced mounting external pressure. Shareholders were increasingly scrutinizing 2023 proxy season pay gap proposals and demanding transparency on compensation practices. Regulators in key markets, particularly the European Union, were tightening requirements around pay transparency and equal pay audits. The company’s ability to attract and retain top talent especially diverse candidates was being undermined by uncertainty about fair compensation. Without concrete data and a clear remediation strategy, the organization risked both reputational damage and regulatory penalties. The HR team knew they needed a solution that could rapidly integrate data from multiple sources, perform sophisticated pay equity analysis, and deliver actionable insights to leadership. Traditional approaches annual audits conducted by external consultants were too slow and too expensive to address the scale of the problem. The organization needed to move from reactive, point-in-time analysis to continuous, real-time pay equity monitoring. The Solution: Implementing AI-Powered Pay Equity Analytics After evaluating several vendors, the organization selected Agile HR Analytics (AHA!) as their pay equity analytics platform. The choice was driven by three critical factors: the ability to rapidly integrate HR, payroll, and survey data; the flexibility to deploy on-premises to meet data sovereignty requirements in regulated markets; and the power of AI-driven insights to identify root causes of pay gaps, not just surface-level disparities. Phase 1: Data Integration and Preparation (Weeks 1-3) The implementation began with a focused data integration phase. Agile HR Analytics’ pre-built connectors enabled rapid integration with the company’s HRIS, payroll platform, and employee survey tools. Unlike traditional analytics solutions that require months of custom ETL (extract, transform, load) development, the platform’s ready-to-use data models for HR and compensation allowed the team to begin analysis within days. The first critical step was establishing a single, unified view of the workforce. The platform ingested: Employee master data from the HRIS (job title, department, location, hire date, tenure, performance ratings) Compensation data from the payroll system (base salary, bonus, equity grants, total cash compensation) Demographic data from employee profiles and HR records (gender, ethnicity, age, education level) Survey data from engagement and inclusion surveys (perception of pay fairness, retention risk signals) Performance and promotion data to establish context for compensation decisions The data integration process revealed immediate insights. Demographic data was inconsistently captured across systems some fields used different coding standards, others were incomplete. The payroll system recorded bonuses differently across regions, and equity grant data required special handling to account for vesting schedules and currency fluctuations. Agile HR Analytics’ AI assistant, XAHA, was instrumental in this phase. Rather than requiring data engineers to write complex SQL queries or Python scripts, HR analysts could use natural language to ask questions about data quality and gaps. XAHA identified missing demographic data for 8% of the workforce, flagged inconsistent job classification codes that could skew analysis, and highlighted regional differences in bonus structures that needed to be normalized for fair comparison. Within three weeks, the organization had a clean, integrated dataset representing 15,247 employees with consistent demographic, compensation, and performance attributes ready for analysis. Phase 2: Pay Equity Analysis and Root Cause Identification (Weeks 4-6) Once the data foundation was established, the analytics team deployed Agile HR Analytics’ pre-built pay equity dashboard. This dashboard provided immediate visibility into compensation disparities across multiple dimensions: Gender Pay Gap Analysis The initial analysis revealed a global gender pay gap of 8.2% when comparing median salaries of women to men across the organization. However, this headline figure masked significant variation by job level, function, and geography. Using the platform’s drill-down capabilities, the team discovered: In technical roles, women earned 6.4% less than men at the same level In business operations, the gap was 12.1% In leadership positions (director and above), women earned 15.3% less than men Crucially, the pay equity analytics revealed that the gap was not primarily driven by job classification or performance. Women and men in identical roles with similar tenure and performance ratings still showed compensation disparities, suggesting historical pay inequities that had compounded over time. Ethnicity-Based Disparities The analysis also uncovered ethnicity-based pay gaps that were less visible in headline figures but deeply troubling when examined: Employees identifying as Black or African American earned 7.8% less than white employees at the same level Hispanic and Latino employees earned 6.3% less Asian employees showed a 2.1% premium compared to white employees, reflecting concentration in higher-paying technical roles These disparities were particularly pronounced in mid-level and senior roles, where historical hiring and promotion patterns had created demographic imbalances. Intersectional Analysis One of the most powerful features of the platform was its ability to examine pay gaps at demographic intersections. The analysis revealed that women of color faced compounded disparities: Black women earned 12.4% less than white men at the same level Latina women earned 10.8% less Asian women earned 6.2% less This intersectional lens, highlighted in research on pay equity analysis at demographic intersections, proved essential for understanding the full scope of inequity. Root Cause Identification Using AI The most valuable aspect of the pay equity analytics solution was its ability to move beyond

Read More