
Power BI Embedded vs Published Apps for Secure Global HR Dashboard Delivery
Overview: Two Paths to Secure Global HR Dashboard Delivery Organizations managing HR analytics at enterprise scale face a critical decision: how to deliver secure, role-based HR dashboards to global teams without compromising data privacy or governance. The choice between Power BI Embedded and Power BI Published apps shapes your architecture, licensing strategy, security posture, and long-term operational costs. This comparison examines both approaches through the lens of HR-specific requirements: compliance with GDPR and CCPA, support for global workforce data, role-based access controls (RBAC), and rapid deployment of pre-built HR data models. Whether you’re evaluating Agile HR Analytics solutions built on the Microsoft stack or planning your own Power BI HR analytics infrastructure, understanding these two deployment models is essential for making an informed decision. Both Power BI Embedded and Published apps leverage the same underlying visualization engine and data models, but they differ fundamentally in how they manage authentication, licensing, capacity, and user experience. For CHROs and HR analytics teams, this distinction directly impacts security architecture, total cost of ownership, and the speed at which you can deploy dashboards to stakeholders across time zones and regulatory jurisdictions. What is Power BI Embedded? Power BI Embedded is a capacity-based embedding solution designed for organizations that need to integrate Power BI reports and dashboards directly into custom applications, portals, or web platforms. Rather than requiring users to authenticate through Power BI’s native interface, Embedded allows you to programmatically embed content and manage access via your application’s authentication layer. In an Embedded architecture, you provision dedicated capacity (measured in Virtual Cores or v-cores) in Azure. This capacity runs independently from the shared Power BI service, giving you granular control over performance, security, and resource allocation. Users access dashboards through your application without needing Power BI licenses; instead, your organization pays for the underlying capacity infrastructure. For HR teams, Power BI Embedded shines when you’re building a unified people analytics portal that spans multiple HR systems. You can integrate HR, payroll, and survey data into a single application experience, control exactly who sees which datasets through row-level security (RLS), and ensure that sensitive compensation or attrition data never appears in Power BI’s public sharing interface. According to Microsoft’s comprehensive Power BI Embedded documentation, the Embedded model supports two authentication patterns: app-owns-data (where your application authenticates to Power BI on behalf of users) and user-owns-data (where individual users authenticate directly). The choice between these patterns significantly affects your security and licensing strategy, particularly in regulated HR environments. What are Power BI Published Apps? Power BI Published apps represent the native, cloud-first approach to sharing dashboards and reports. When you publish an app in Power BI, you’re leveraging the Power BI Service’s built-in distribution, authentication, and licensing mechanisms. Users authenticate directly to Power BI (via Azure Active Directory or organizational credentials), and access is controlled through Power BI’s role-based security model and app-level permissions. Published apps are the simpler, lower-friction path for most organizations. You create reports and dashboards in Power BI Desktop, publish them to a workspace, and bundle them into an app. Users discover the app in their Power BI home, and you control which users or groups can access it. The Power BI Service handles authentication, audit logging, and compliance automatically. For HR teams, Published apps work exceptionally well when your audience is primarily internal employees with organizational Azure AD accounts. You can rapidly deploy dashboards—such as workforce planning dashboards, pay equity analytics, or attrition prediction models—without building custom applications or managing authentication infrastructure. The strength of Published apps lies in simplicity and speed. If you’re already using Microsoft 365 and Azure AD, your HR leaders and analysts likely have Power BI licenses or can obtain them quickly. There’s no custom development required; you focus entirely on data modeling and report design. This is why many organizations evaluating how to build an HR analytics dashboard in Power BI start with Published apps as their first deployment path. Licensing Models: A Critical Cost Driver Licensing represents one of the most significant differences between these two approaches, and it directly impacts your total cost of ownership at scale. Power BI Embedded Licensing Power BI Embedded uses capacity-based licensing. You purchase dedicated v-cores in Azure, typically in increments (A1, A2, A3, A4, A5 SKUs, or P1 through P5 for premium capacities). Each v-core tier supports a specific number of concurrent users and query operations per second. You pay a monthly subscription fee for the capacity, regardless of how many users access your dashboards or how much they use them. This model is cost-effective when you have a large, distributed user base. If you’re delivering HR dashboards to 5,000 global employees, Embedded capacity spreads the cost across the entire population. You’re not buying individual licenses; you’re buying computational infrastructure. However, Embedded capacity requires upfront investment and capacity planning. You must forecast peak demand and provision accordingly. If your HR dashboards are used sporadically or by a small subset of employees, you may overprovision capacity and waste budget. Conversely, underprovisioning leads to performance degradation during peak usage windows. According to comparative analysis of Power BI licensing models, Embedded capacity also requires you to manage autoscale policies, monitor performance metrics, and adjust capacity dynamically based on actual usage patterns. This operational overhead is often underestimated by organizations planning HR analytics deployments. Power BI Published Apps Licensing Published apps use per-user licensing. Each user who accesses Power BI reports must hold a Power BI Pro or Premium Per User license. A Power BI Pro license costs approximately $10-15 per user per month (depending on your region and licensing agreement). Premium Per User licenses are more expensive but include additional features like larger data refresh rates and extended retention. For small, focused teams—such as your HR analytics center of excellence or compensation team—Published apps are economical. If only 50 people need to access HR dashboards, you’re looking at $500-750 per month in licensing costs. Scale that to 500 users, and the math shifts: $5,000-7,500 per month becomes difficult to justify.

Serving Attrition Models: Azure ML Endpoints vs Embedded DAX and Power BI Approaches
Overview: Two Paths to Predictive Attrition Analytics When building enterprise HR analytics solutions, one of the most critical decisions data teams face is how to serve machine learning models that predict employee attrition. Should you deploy trained attrition models as Azure Machine Learning endpoints, or embed predictive logic directly within Power BI using DAX calculations? This choice shapes your architecture, operational complexity, cost structure, and ultimately the speed and reliability of your people insights. For organizations using the Microsoft stack—particularly those leveraging Agile HR Analytics for AI-powered workforce insights—understanding these two approaches is essential. Each method offers distinct advantages depending on your data volume, real-time requirements, governance needs, and technical resources. Azure ML endpoints provide scalable, production-grade inference with advanced monitoring and governance, while embedded DAX approaches offer simplicity, lower latency, and reduced operational overhead. This comparison explores both architectures in depth, examining technical implementation, performance characteristics, cost implications, security considerations, and practical recommendations for different organizational scenarios. Whether you’re a CHRO evaluating enterprise HR analytics platforms, a data engineer designing prediction pipelines, or an IT leader assessing deployment options, this guide will help you make an informed decision aligned with your organizational priorities. Understanding Attrition Models in HR Analytics Attrition prediction models are among the most valuable applications of machine learning in human resources. These models analyze historical employee data—tenure, compensation, engagement scores, role changes, performance ratings, and organizational factors—to identify individuals or segments at high risk of leaving. The business impact is significant: early identification of flight risks enables proactive retention interventions, reducing costly turnover and preserving institutional knowledge. In the context of enterprise HR analytics strategy, attrition models typically integrate with broader HR data integration efforts. Your HRIS, payroll systems, employee surveys, and business data (department, location, manager tenure) all feed into model training. Once trained, the model must be deployed somewhere accessible to HR teams, managers, and business stakeholders who need to act on predictions. The challenge is not training the model—that’s typically a one-time or periodic data science task. The challenge is serving predictions reliably, securely, and cost-effectively to end users who need real-time or near-real-time insights. This is where Azure ML endpoints and embedded DAX approaches diverge significantly. Azure ML Endpoints: Production-Grade Inference at Scale Architecture and Deployment Azure Machine Learning endpoints represent the traditional enterprise approach to model serving. When you deploy an attrition model as an Azure ML endpoint, you’re creating a containerized, scalable inference service hosted on Azure infrastructure. The model—trained in Python using scikit-learn, XGBoost, or other frameworks—is packaged with its dependencies and deployed to a managed compute cluster. The deployment process involves several steps: first, you register your trained model in the Azure ML model registry; second, you create an inference script (entry_script.py) that defines how input data is transformed and passed to the model; third, you define the environment with required Python packages; finally, you deploy to a managed endpoint that provides a REST API. This REST endpoint becomes callable from any application, including Power BI reports. Microsoft’s official documentation on consuming Azure Machine Learning models in Power BI outlines the integration pathway. When Power BI queries an Azure ML endpoint, it sends employee data as JSON, receives predictions in response, and can display attrition risk scores alongside other HR metrics. The InferenceSchema Python package is essential for this integration, as it generates the input and output schemas that Power BI needs to properly format requests and parse responses. Real-Time Inference and Scalability One of the primary advantages of Azure ML endpoints is their ability to handle real-time inference at scale. When a manager opens an HR analytics dashboard or a data team runs a batch prediction job, the endpoint receives requests and returns predictions within milliseconds. Azure’s infrastructure automatically scales compute resources based on demand, ensuring consistent performance during peak usage periods. For large organizations with thousands of employees and complex attrition models, this scalability is critical. If your attrition model includes deep feature engineering—interaction terms, rolling averages of engagement scores, departmental aggregations—computing these predictions on-demand for every dashboard refresh can strain embedded approaches. Azure ML endpoints handle this gracefully, distributing inference across multiple compute instances. Batch inference is another strength. If you want to score all 10,000 employees weekly to identify new flight risks, Azure ML batch endpoints can process large datasets efficiently, returning predictions in bulk without impacting interactive dashboard performance. This separation of batch and real-time workloads is architecturally sound for enterprise scenarios. Monitoring, Governance, and Model Management Azure ML provides sophisticated monitoring and governance capabilities that embedded approaches cannot match. You can track prediction latency, error rates, and data drift—detecting when incoming employee data distributions shift away from training data. If your attrition model was trained on 2023 data but it’s now 2025, data drift alerts notify you that model retraining may be necessary. Model versioning is built in. You can deploy multiple versions of your attrition model simultaneously, gradually shifting traffic from an older version to a newly retrained one. This canary deployment pattern reduces risk when updating models. You can also log all prediction requests and responses for audit trails—critical in regulated industries where compensation and workforce decisions must be defensible. Role-based access control (RBAC) in Azure ML ensures that only authorized data scientists can modify models or access prediction logs. This governance layer is essential for organizations in regulated industries handling sensitive HR data. Combined with Agile HR Analytics’ emphasis on RBAC and data isolation, Azure ML endpoints fit naturally into enterprise security frameworks. Integration with Power BI and the Microsoft Stack Integration between Azure ML and Power BI has matured significantly. The Azure Machine Learning and Power BI integration approach allows you to reference Azure ML endpoints directly in Power BI reports. When a user interacts with a dashboard—filtering by department or tenure band—Power BI automatically calls the endpoint to refresh predictions for the filtered subset. This integration works because both services are part of the Microsoft ecosystem. Authentication flows through Azure Active Directory, data moves securely over
Pay Equity Auditing Methods: Traditional Statistical Tests vs Machine Learning Approaches
Understanding Pay Equity Auditing in the Modern Enterprise Pay equity has become one of the most critical compliance and fairness priorities for enterprise organizations worldwide. As regulatory mandates expand across North America, Europe, and beyond, HR leaders and compensation teams face mounting pressure to demonstrate that their compensation practices are equitable, defensible, and free from systemic bias. The stakes are high: inadequate pay equity auditing can expose organizations to legal liability, regulatory penalties, reputational damage, and talent retention challenges. However, the methods available for conducting pay equity audits vary significantly in their complexity, cost, interpretability, and effectiveness. Organizations must choose between time-tested statistical approaches that have served HR and legal teams for decades, and emerging machine learning techniques that promise greater sophistication and pattern detection. Neither approach is universally superior; instead, the optimal choice depends on your organization’s size, data maturity, regulatory environment, and strategic objectives. This comprehensive comparison examines both traditional statistical testing methods and modern machine learning approaches for pay equity auditing. We’ll explore the mechanics of each approach, analyze their respective strengths and limitations, and provide guidance on selecting the right methodology for your organization’s unique circumstances. What Is Pay Equity Auditing and Why It Matters Pay equity auditing is the systematic analysis of compensation data to identify whether employees in similar roles, with comparable qualifications and performance levels, receive equitable compensation regardless of protected characteristics such as gender, race, ethnicity, age, or other legally protected statuses. Unlike pay transparency, which simply discloses salary information, pay equity auditing actively investigates whether compensation differences are justified by legitimate business factors. The importance of pay equity auditing extends far beyond compliance. Organizations that proactively audit pay equity benefit from improved employee retention, enhanced employer brand reputation, reduced litigation risk, and stronger alignment with organizational values. Additionally, as states and countries increasingly mandate pay equity reporting and analysis, organizations that have already conducted thorough audits are better positioned to respond quickly to regulatory requirements. According to SHRM’s reporting on pay equity audits, more than a dozen U.S. states have already enacted or are considering legislation requiring employers to conduct and report on pay equity analyses. This regulatory momentum underscores why choosing the right auditing methodology is no longer optional for enterprise organizations. Traditional Statistical Testing Methods for Pay Equity Analysis Traditional statistical approaches to pay equity auditing have been refined over decades and remain the gold standard in legal and compliance contexts. These methods rely on established statistical principles, are well-understood by legal professionals, and have extensive case law supporting their validity. Multiple Regression Analysis Multiple regression analysis is perhaps the most widely used traditional method for pay equity auditing. This approach models compensation as a function of legitimate business factors such as job level, tenure, performance rating, education, and geographic location. By controlling for these legitimate factors, analysts can isolate whether protected characteristics (gender, race, etc.) have a statistically significant effect on compensation. The power of regression analysis lies in its ability to simultaneously account for multiple variables. Rather than comparing compensation in isolation, regression creates a statistical model that estimates what an employee “should” earn based on legitimate factors. Actual compensation is then compared to this predicted value; unexplained gaps may indicate pay inequity. As explained in Statistics 101 for Pay Equity, regression analysis allows organizations to control for legitimate pay determinants while isolating the effect of protected characteristics. How Employers Can Use Regression Analyses in Pay Equity Cases emphasizes that regression-based analyses provide strong defensibility in litigation, as the methodology is well-established and accepted by courts. Hierarchical regression, a variant of this approach, allows analysts to test how much additional variance in compensation is explained by adding protected characteristics to a model that already accounts for legitimate business factors. This sequential approach provides clear evidence of whether protected characteristics significantly influence pay decisions. Cohort Analysis and Stratification Cohort analysis involves dividing employees into comparable groups (cohorts) based on legitimate business factors such as job title, department, location, and tenure band. Within each cohort, compensation is compared across protected characteristic groups. This approach is particularly valuable for identifying localized pay inequities that might be masked in organization-wide analyses. Cohort analysis excels at transparency and interpretability. When you identify a pay gap within a specific cohort, stakeholders can immediately understand which groups are affected and in what context. This clarity is invaluable for both internal remediation efforts and external regulatory communications. However, cohort analysis has a critical limitation: it can only examine one or two variables at a time without becoming unwieldy. If you need to control for multiple legitimate business factors simultaneously, regression analysis typically provides more sophisticated analysis. Additionally, cohort analysis can be vulnerable to small sample sizes within individual cohorts, which may lead to unstable statistical estimates. T-Tests and Non-Parametric Tests Simpler statistical tests, such as independent samples t-tests and non-parametric alternatives like the Mann-Whitney U test or Wilcoxon Rank Sum test, are sometimes used to compare compensation between groups. These tests are straightforward to understand and explain to non-technical audiences. According to Statistical Pay Equity Analyses: Data and Methodological Approaches, Rank Sum tests and median tests provide useful initial screening for pay differences. However, these univariate approaches have a significant weakness: they compare compensation across only one dimension at a time and do not control for legitimate business factors. A significant t-test result might indicate a pay gap, but it could be entirely explained by differences in job level, tenure, or performance between the groups being compared. For this reason, simple t-tests are typically used as preliminary screening tools rather than as the primary basis for pay equity conclusions. They can quickly identify areas requiring deeper investigation, but more sophisticated analysis is usually needed to draw defensible conclusions about inequity. Sensitivity Testing and Robustness Checks An often-overlooked but essential component of traditional statistical pay equity analysis is sensitivity testing. This involves repeating the analysis using different assumptions, variable definitions, or statistical models to assess whether conclusions remain stable. For example, analysts might test whether
7 Common HRIS-to-Agile HR Analytics Integration Patterns and When to Use Them
Why HRIS Integration Patterns Matter for Your HR Analytics Strategy Integrating your Human Resource Information System (HRIS) with an HR analytics platform is one of the most critical decisions your HR and data teams will make. The pattern you choose determines how quickly you access insights, how fresh your data remains, and ultimately whether your analytics investment delivers real business value. Many organizations struggle with HRIS integration because they adopt a one-size-fits-all approach. However, the reality is far more nuanced. Different integration patterns serve different business needs, data volumes, compliance requirements, and technical architectures. A global financial services firm with strict data residency requirements will need a different strategy than a mid-market SaaS company with simpler infrastructure. Agile HR Analytics, built on the Microsoft stack including Power BI, Azure, and Azure OpenAI, supports multiple integration patterns to accommodate these diverse scenarios. Understanding which pattern aligns with your organizational needs, technical capabilities, and business objectives is essential for successful deployment and long-term analytics maturity. This article explores seven common HRIS-to-Agile HR Analytics integration patterns, explains when each is most appropriate, and provides guidance for selecting the right approach for your enterprise. Whether you’re evaluating integration strategies or optimizing an existing implementation, this framework will help you make informed decisions that accelerate your path to actionable people insights. 1. Batch File Export and Import Pattern The batch file export and import pattern remains one of the most widely used HRIS integration approaches, particularly in organizations with established data warehouses or those transitioning from legacy systems. In this pattern, your HRIS system exports data to flat files (typically CSV or Excel) on a scheduled basis—daily, weekly, or monthly—and those files are then imported into Agile HR Analytics through Power BI or Azure Data Factory. This pattern works by having your HRIS system generate standardized data exports containing employee records, compensation data, organizational hierarchies, and other HR metrics. Your IT or data engineering team then schedules automated jobs to pick up these files from a designated folder, validate the data, and load it into your analytics platform. The process is straightforward, requires minimal custom development, and works well when your HRIS vendor doesn’t offer robust APIs or when your organization prefers a decoupled, asynchronous approach to data movement. The batch pattern is particularly valuable when you’re dealing with 7 common HRIS challenges that manufacturers and other enterprises face, including legacy system constraints and data standardization issues. File-based integration allows you to apply transformation logic independently of your source system, giving you flexibility to reshape data for analytics purposes without impacting operational HRIS processes. When to use the batch pattern: This approach is ideal when your HRIS vendor doesn’t provide modern APIs, when you have infrequent analytics refresh requirements (daily or weekly rather than real-time), when you need maximum control over data transformation, or when your organization operates in a highly regulated industry with strict audit trails. It’s also excellent for initial implementations where you want to establish data quality baselines before moving to more sophisticated patterns. Key considerations include file management overhead, latency in data availability, and the need for robust error handling and reconciliation processes. You’ll want to implement version control for your data files, maintain detailed audit logs, and establish clear data validation rules. When properly implemented with tools like Azure Data Factory, the batch pattern can scale effectively even for large organizations with complex data requirements. 2. Direct API Integration with Scheduled Polling The scheduled API polling pattern leverages your HRIS vendor’s application programming interface (API) to pull data directly into Agile HR Analytics on a regular schedule. Rather than waiting for file exports, your integration layer—typically Azure Data Factory, Logic Apps, or custom Python scripts—calls the HRIS API at specified intervals to retrieve updated employee data, compensation information, organizational structures, and other HR metrics. This pattern offers significant advantages over file-based approaches. APIs provide more granular data access, better error handling, and the ability to query only changed records since your last sync. Many modern HRIS platforms including Workday, SuccessFactors, and others have invested heavily in API capabilities, making this pattern increasingly viable. The direct connection also eliminates file management overhead and provides better data freshness without requiring your HRIS team to manually generate and manage exports. When implementing scheduled API polling with Agile HR Analytics, you typically set up an Azure Data Factory pipeline that calls your HRIS API every few hours or daily, processes the response, and loads the data into your Power BI models or data warehouse. The pattern works well because it’s more efficient than batch files—you can use incremental load techniques to sync only changed data—and it provides better visibility into data quality through API response codes and error messages. When to use the API polling pattern: This approach is ideal when your HRIS vendor provides robust, well-documented APIs, when you need more frequent data updates than daily (hourly or every few hours), when you want to eliminate file management complexity, or when you’re building a more modern, cloud-native architecture. It’s particularly valuable for organizations implementing enterprise integration patterns for AI-powered HRIS systems that require flexible, scalable data movement. Key considerations include API rate limits, authentication and security token management, error handling for failed requests, and the need to implement proper retry logic. You’ll need to monitor API performance and plan for vendor-imposed rate limits. However, the operational benefits—reduced manual intervention, better error visibility, and incremental load capabilities—typically make this pattern worth the initial setup complexity. 3. Real-Time Event-Driven Streaming Pattern For organizations that need immediate insights into HR changes, the real-time event-driven streaming pattern delivers data to Agile HR Analytics as events occur in your HRIS system. Rather than scheduled batches or periodic API calls, your HRIS system publishes events—such as new hire, termination, promotion, or compensation change—to a message queue or event bus. Agile HR Analytics subscribes to these events and ingests them in near-real-time, enabling dashboards and AI-powered insights to reflect changes within minutes or seconds. This pattern typically uses Azure

6 Data Fields Finance Should Provide for Accurate Total Workforce Cost Modeling
Why Accurate Workforce Cost Modeling Matters Total workforce cost modeling stands at the intersection of human resources and financial planning, yet many organizations struggle to align these two critical functions. When finance and HR operate in silos, the result is incomplete data, inaccurate forecasts, and missed opportunities for strategic decision-making. According to research on workforce modeling fundamentals for FP&A teams, the most successful organizations treat workforce cost as a core financial metric that demands the same rigor as any other business expense. The challenge is straightforward: HR teams track employee information, compensation, and benefits through HRIS systems, while finance manages budgets, payroll, and cost allocations through accounting systems. Without a unified data strategy, these systems remain disconnected, leading to discrepancies in reporting and forecasting. This is where HR data integration becomes essential. When finance provides the right data fields to HR analytics teams, organizations can build comprehensive workforce cost models that inform strategic decisions about hiring, compensation, restructuring, and long-term financial planning. For CHROs, people analytics leaders, and finance business partners, understanding which data fields are non-negotiable is the first step toward building an accurate, actionable workforce cost model. Using platforms like Agile HR Analytics, which integrates HR, payroll, and business data through ready-to-use dashboards and AI-powered insights, organizations can transform fragmented data into strategic intelligence. This article outlines the six critical data fields that finance must provide to ensure your workforce cost models are both accurate and actionable. 1. Base Salary and Compensation Structure Data Base salary is the foundation of any workforce cost model, yet its definition and application vary significantly across organizations. Finance must provide detailed compensation structure data that goes beyond a simple annual salary figure. This includes the current base salary for each employee, salary bands by role or level, and any recent salary adjustments or market-rate changes. What makes this data field critical is that it serves as the anchor for all downstream cost calculations. When finance provides clean, standardized salary data, HR analytics teams can build models that forecast compensation costs under different scenarios. For instance, if your organization is planning a 3% merit increase across the board, accurate base salary data allows you to model the financial impact with precision. Additionally, understanding salary structures by job family, department, or geography enables more granular workforce cost analysis. Finance should also provide information about salary adjustment schedules, such as annual review cycles or promotion patterns. This allows analytics teams to forecast future compensation costs rather than simply reporting historical spend. According to workforce cost forecasting best practices, salary data is the single largest component of total workforce cost, often representing 50-60% of total labor expenses. When implementing HR analytics dashboards in Power BI, clean salary data is essential for creating accurate compensation analysis and supporting pay equity compliance initiatives. Finance teams should ensure that salary data is updated regularly, validated for accuracy, and provided in a standardized format that can be easily integrated with HR systems. 2. Benefits and Total Rewards Cost Data Base salary tells only part of the story. Benefits and total rewards represent a substantial portion of total workforce cost, often accounting for 25-35% of total labor expenses. Finance must provide comprehensive data on all benefits costs, including health insurance premiums (both employer and employee contributions), retirement plan contributions, life insurance, disability insurance, wellness programs, and any other employee benefits. This data field is particularly important because benefits costs vary significantly by employee level, tenure, and employment status. A full-time executive may have different benefits than a part-time contractor, and these differences must be reflected in workforce cost models. Finance should provide benefits data at the individual employee level, not just as departmental or company-wide averages, to enable accurate modeling of total rewards. Additionally, finance must communicate how benefits costs are allocated. Some organizations allocate benefits as a percentage of salary, while others use fixed per-employee amounts or tiered structures. Understanding the allocation methodology is critical for building accurate cost models. As outlined in total cost of the workforce best practices, comprehensive benefits data should include employer contributions to health, retirement, and welfare programs, as well as voluntary benefits that employees elect. For organizations using AI-powered HR analytics platforms, benefits data becomes even more valuable when combined with employee lifecycle data. This allows HR teams to model the cost impact of benefits changes, such as shifting from a defined benefit to a defined contribution retirement plan, or adjusting health insurance coverage levels. 3. Payroll Taxes and Statutory Contributions Payroll taxes and statutory contributions represent a significant but often overlooked component of total workforce cost. Finance must provide detailed data on all payroll tax obligations, including federal income tax withholding, Social Security, Medicare, unemployment insurance (federal and state), and any state or local income taxes. The complexity increases for organizations with employees across multiple states or countries. What makes this data field essential is that payroll taxes are non-discretionary costs that directly impact the total cost of employment. An employee with a $100,000 salary may have an additional 12-15% in payroll taxes, depending on location and compensation structure. Finance must provide the effective tax rates or actual tax amounts by employee, so that analytics teams can accurately model total compensation cost. For global organizations, this becomes even more complex. Different countries have different statutory contribution requirements, such as social security contributions, health insurance contributions, and pension contributions. Finance should provide a clear breakdown of these costs by country or region, enabling HR analytics teams to build accurate cost models for each geographic location. According to workforce cost forecasting guidance, payroll taxes should be calculated as a percentage of gross compensation and included in all workforce cost models. When building workforce planning strategies for global organizations, accurate payroll tax data is critical for comparing true employment costs across regions and making informed decisions about workforce allocation and expansion. 4. Overtime, Bonuses, and Variable Compensation Data While base salary provides a foundation, many organizations pay significant variable compensation in the form of overtime,
6 Real-World Use Cases for XAHA in Talent Mobility and Internal Hiring
Introduction: Why Talent Mobility and Internal Hiring Matter More Than Ever Talent mobility and internal hiring have become strategic imperatives for enterprise organizations. Rather than constantly recruiting externally at significant cost and time investment, forward-thinking companies are recognizing the value of developing and promoting talent from within. According to research on internal talent mobility strategies, organizations that prioritize internal career paths see improved employee engagement, reduced turnover, and faster time-to-productivity for new roles. However, identifying the right internal candidates for the right opportunities remains a complex challenge. HR teams struggle with visibility into employee skills, career aspirations, and readiness for advancement. Traditional spreadsheets and manual processes cannot scale across global organizations with thousands of employees. This is where AI-powered people analytics becomes transformational. XAHA, the AI assistant built into Agile HR Analytics, changes the game. By leveraging machine learning, natural language processing, and integrated HR data, XAHA enables CHROs, talent leaders, and HR analytics teams to uncover hidden talent, match skills to opportunities, and make data-driven decisions about internal mobility at scale. This article explores six real-world use cases demonstrating how XAHA drives measurable outcomes in talent mobility and internal hiring. 1. Identifying Hidden Talent Through Skills Gap Analysis One of the most powerful applications of XAHA is uncovering overlooked talent within your organization. Many employees possess skills that extend far beyond their current job descriptions, yet these capabilities remain invisible to hiring managers and talent teams. XAHA solves this problem by analyzing structured HR data, employee surveys, performance reviews, and training records to build a comprehensive skills inventory. Consider a mid-sized technology company with 5,000 employees spread across multiple business units. The organization needs to fill 15 senior analyst roles but faces competition from external recruiters. Using XAHA, the HR analytics team uploads integrated HR, payroll, and survey data into Agile HR Analytics’ platform. XAHA immediately analyzes the data and identifies 47 internal candidates who possess the required technical and soft skills, even though most are currently in different roles. The AI assistant goes further by ranking candidates based on skill match, readiness for advancement, and engagement levels. It highlights individuals who have completed relevant training, received high performance ratings, and expressed interest in career development through employee surveys. This approach, supported by research on AI-powered talent matching, dramatically reduces hiring time and cost while improving retention by promoting internal talent. When implementing this use case, organizations should ensure they have integrated HR, payroll, and survey data into their analytics platform. XAHA’s ability to surface insights depends on data quality and completeness. By combining structured HRIS data with unstructured survey responses and performance feedback, the AI assistant builds a 360-degree view of each employee’s capabilities. 2. Predicting Internal Promotion Success and Readiness Not every high performer is ready for the next level. Promoting someone too early can lead to failure, disengagement, and costly turnover. XAHA addresses this challenge by analyzing historical promotion data to identify patterns that predict success in higher-level roles. The AI assistant examines factors such as performance trajectory, engagement scores, leadership competencies, tenure, and previous role transitions to create predictive models for promotion readiness. Imagine a global financial services organization with 20,000 employees across 15 countries. The company needs to identify and develop the next generation of leaders but lacks visibility into who is truly ready for management roles. Using XAHA, the talent team creates a custom dashboard that scores every employee on promotion readiness. The AI assistant weighs multiple factors: performance ratings over the past three years, engagement survey responses, 360-degree feedback from peers and managers, internal mobility history, and skills alignment with target roles. XAHA’s predictive models reveal that employees with a specific combination of attributes (high engagement, previous lateral moves, strong peer feedback, and relevant training) have an 85% success rate in their next promotion, compared to 62% for the general population. This insight allows the organization to focus development resources on high-potential employees and proactively address gaps before promotion decisions are made. This use case directly supports the enterprise HR analytics strategy that many CHROs are implementing. By using data-driven readiness assessments, organizations reduce the risk of failed promotions and improve leadership pipeline strength. XAHA can be configured to monitor specific competencies relevant to your organization’s culture and business strategy. 3. Creating Personalized Internal Career Path Recommendations Employees increasingly expect personalized career development opportunities. Generic career frameworks no longer engage top talent. XAHA enables HR teams to create individualized career path recommendations based on each employee’s skills, interests, performance, and market demand for their capabilities. Consider a large manufacturing company with multiple divisions and hundreds of potential career trajectories. The organization wants to improve internal mobility and reduce external hiring, but employees struggle to understand what advancement opportunities exist. XAHA transforms this dynamic by analyzing each employee’s profile and recommending specific next-step roles that align with their capabilities and aspirations. For example, an employee in operations might receive a recommendation to transition into supply chain management based on their demonstrated analytical skills, logistics training, and expressed interest in supply chain development (captured in employee surveys). XAHA not only recommends the role but also identifies skill gaps, suggests targeted training programs, and connects the employee with mentors who have successfully made similar transitions. This approach, highlighted in talent mobility implementation guides, significantly improves employee engagement and retention. When employees see clear internal career paths and receive personalized development recommendations, they are more likely to stay with the organization. XAHA makes these recommendations scalable by automating the analysis and recommendation process across thousands of employees. To implement this effectively, ensure your HR analytics dashboard includes career path visualizations and that XAHA has access to comprehensive skills assessments, training records, and employee feedback data. 4. Matching Internal Candidates to Specific Job Openings in Real Time When a critical role opens, speed matters. Lengthy external recruitment processes delay business outcomes and increase costs. XAHA accelerates internal hiring by instantly matching job requirements to internal candidate profiles. The AI assistant analyzes the job description, identifies required skills and competencies, and automatically surfaces the best-qualified internal
8 Configuration Checks Compensation Managers Must Run Before Publishing Pay Equity Dashboards
Introduction: Why Configuration Checks Matter Before Publishing Pay Equity Dashboards Publishing a pay equity dashboard without proper configuration checks is like launching a ship without inspecting the hull. The consequences can be severe: data inaccuracies that lead to flawed compensation decisions, compliance violations that expose your organization to legal risk, and loss of trust from leadership if insights prove unreliable. For compensation managers and HR analytics teams, the stakes have never been higher. Pay equity has moved from a nice-to-have initiative to a business-critical imperative. Regulatory bodies across North America, the UK, and EU are tightening requirements around equal pay transparency and documentation. Organizations are facing increased scrutiny from employees, investors, and regulators alike. A single misconfiguration in your pay equity dashboard can undermine months of work and damage your credibility with the C-suite. The good news is that systematic configuration checks can prevent these problems entirely. By running through a structured validation process before publishing, you ensure that your dashboard delivers accurate, compliant, and actionable insights. This article walks you through eight essential configuration checks that compensation managers should complete, drawing on best practices from enterprise HR analytics teams and industry standards for pay equity analysis. Whether you’re building pay equity dashboards in Power BI or other platforms, these checks apply universally. They address data integrity, calculation accuracy, security controls, and governance standards that protect both your organization and your employees. Let’s dive into each check and explore why it matters. 1. Verify Data Source Connections and Refresh Schedules Your pay equity dashboard is only as reliable as the data feeding it. Before publishing, you must verify that all data source connections are functioning properly and that refresh schedules align with your compensation cycle timing. Start by confirming that your dashboard connects to the authoritative sources for compensation data: your HRIS system, payroll platform, and any external benchmarking tools. Many organizations pull data from multiple systems, and even a single broken connection can skew results. Test each connection manually to ensure it returns expected data volumes and field values. Next, establish a refresh schedule that makes sense for your compensation cycle. If you’re conducting a mid-year pay equity audit, a daily refresh might be excessive and create confusion as data changes. Conversely, if your dashboard supports real-time compensation decisions, stale data could lead to poor choices. Most organizations find that weekly or bi-weekly refreshes work well for pay equity dashboards, aligned with your compensation review timeline. Document your refresh schedule clearly in dashboard metadata and governance documentation. When stakeholders view the dashboard, they should immediately understand how current the data is. This transparency prevents misinterpretation and supports compliance audits. If you’re using HR data integration across multiple systems, consider implementing automated validation rules that alert you if data quality drops below acceptable thresholds. According to compensation planning guidance from industry leaders, data verification is the foundation of any pay equity analysis. Before you proceed with other checks, ensure your data plumbing is solid. 2. Validate Compensation Data Elements and Calculations Pay equity analysis depends on accurately defining and calculating compensation. Before publishing your dashboard, you must validate every compensation element included in your analysis and verify that calculations are mathematically correct. Begin by listing all compensation components your dashboard includes: base salary, bonuses, commissions, stock options, benefits, allowances, and any other forms of pay. For each element, document the business definition and any assumptions embedded in your calculation. For example, if you’re including annual bonuses, are you using actual paid amounts or target amounts? Are you annualizing bonuses for employees hired mid-year? These decisions must be consistent and documented. Next, validate your calculations against sample data. Pull a subset of employee records and manually verify that your dashboard calculations match your expectations. Pay particular attention to edge cases: employees on leave, recent hires, employees transitioning between roles, and terminated employees. These scenarios often reveal configuration errors that can skew your pay equity analysis. Consider implementing role-based access controls so that only authorized compensation professionals can view detailed compensation data. This protects employee privacy while enabling your team to conduct thorough analysis. When you integrate HR, payroll, and survey data, ensure that each data source is mapped correctly and that no compensation elements are double-counted or missed. As outlined in comprehensive guides to compensation planning, accurate data collection on all compensation elements is essential before any pay equity analysis. Spend time here—it pays dividends in the quality of your insights. 3. Confirm Job Classification and Leveling Consistency Pay equity analysis requires consistent job classification and leveling. Employees in the same role at the same level should be compared fairly, but inconsistent leveling can create false disparities or mask real ones. Before publishing your dashboard, audit your job classification system. Verify that your job titles, job codes, and job levels are applied consistently across your organization. Many companies discover during this audit that the same role has been titled differently in different departments, or that leveling criteria are applied inconsistently. Create a master job classification reference that your dashboard uses. This reference should map every job title in your HRIS to a standardized job code and level. If your organization uses job families or career bands, ensure these are clearly defined and consistently applied. Document any exclusions (e.g., certain roles excluded from pay equity analysis due to external market rates or unique circumstances). Test your leveling logic by pulling sample reports showing employees by job level and comparing them to your HRIS data. Look for outliers where an employee’s stated level doesn’t match their actual responsibilities. These inconsistencies often point to configuration errors that need correction. When you build your HR analytics dashboard, ensure that job classification filters are clearly labeled and easy to understand. Stakeholders viewing the dashboard should immediately understand how jobs are grouped and compared. This clarity supports both analysis accuracy and governance compliance. 4. Review Demographic Data Accuracy and Privacy Controls Pay equity analysis inherently involves demographic data: gender, race, ethnicity, age, and other protected characteristics. Before publishing your dashboard,
The pre-built workforce planning scenario library in Agile HR Analytics
Overview and First Impressions Agile HR Analytics has emerged as a transformative solution for enterprise HR leaders seeking to move beyond reactive workforce management toward proactive, data-driven planning. The platform’s pre-built workforce planning scenario library represents a significant leap forward in how organizations approach talent strategy, particularly for large, geographically dispersed companies operating in regulated industries. When evaluating the workforce planning scenario library, the first impression is one of maturity and practical utility. Rather than offering a blank canvas that requires extensive customization, Agile HR Analytics delivers ready-to-use scenario models that address common workforce planning challenges: headcount forecasting, cost optimization, skill gap analysis, and organizational restructuring. This approach stands in stark contrast to competitors like Visier and OrgVue, which often require substantial implementation effort before delivering value. The library is built on the Microsoft stack, leveraging Power BI for visualization, Azure for scalability, and Azure OpenAI for intelligent insights through the platform’s AI assistant, XAHA. This technical foundation ensures that organizations already invested in Microsoft technologies can achieve rapid deployment without extensive retooling. For CHROs and senior HR leaders evaluating solutions, this compatibility with existing enterprise infrastructure is a critical differentiator. The platform’s emphasis on rapid deployment is immediately apparent. Rather than spending months on data modeling and scenario creation, HR teams can activate pre-built scenarios within weeks, allowing them to begin exploring workforce futures almost immediately. This speed-to-insight is particularly valuable for organizations facing urgent talent challenges or market disruptions. Understanding the Workforce Planning Scenario Library At its core, the workforce planning scenario library represents a curated collection of analytical templates designed to address the most pressing workforce challenges facing enterprise organizations. These scenarios are not generic templates; they are built on industry expertise and informed by thousands of workforce planning engagements. The library includes scenarios for headcount planning, where organizations can model various growth trajectories, attrition assumptions, and hiring strategies. Another critical scenario addresses cost optimization, allowing finance and HR teams to understand the financial implications of different staffing decisions. Skill-gap analysis scenarios help identify where organizational capabilities diverge from strategic requirements, enabling proactive talent development or recruitment initiatives. What distinguishes Agile HR Analytics from competitors is that these scenarios are pre-built but fully customizable. Organizations can take a scenario template and adapt it to their specific business context, industry dynamics, and strategic priorities. This balance between out-of-the-box utility and flexibility is essential for enterprises that cannot afford the implementation timelines associated with traditional workforce planning tools. The scenarios integrate seamlessly with the platform’s broader data integration capabilities. As outlined in the guide on how to integrate HR, payroll and survey data for people analytics, the platform can pull data from HRIS systems, payroll platforms, engagement surveys, and business systems to populate these scenarios with real, current information. This data integration is foundational; scenarios are only as valuable as the data that informs them. Feature Analysis: Scenario Modeling Capabilities The scenario modeling engine within Agile HR Analytics is sophisticated yet intuitive. The platform allows users to create multiple workforce futures simultaneously, comparing outcomes across different assumptions about hiring, attrition, compensation, and organizational structure. One of the standout features is the ability to model workforce scenarios across multiple dimensions. Users can explore what-if questions such as: “What if we reduce headcount by 10 percent? How does that impact our ability to deliver on strategic initiatives?” or “What if attrition increases to 25 percent? How quickly can we recruit and onboard replacements?” These questions are not merely academic; they directly inform business strategy and risk management. The platform’s integration with Power BI enables sophisticated visualization of scenario outcomes. Rather than reviewing scenarios in spreadsheets or static reports, HR leaders can interact with dynamic dashboards that show the implications of different decisions in real time. This interactivity is crucial for stakeholder engagement; when executives can see how their assumptions translate into workforce outcomes, they are more likely to embrace analytical insights. The AI assistant, XAHA, enhances the scenario modeling experience by suggesting relevant scenarios based on organizational context, identifying anomalies in assumptions, and recommending adjustments that align with industry benchmarks. This AI-powered guidance helps ensure that scenarios remain grounded in reality rather than devolving into speculative exercises. For organizations seeking to understand scenario planning in greater depth, the resource on workforce planning strategy for global organizations provides comprehensive context on how these scenarios fit within broader talent strategy and governance frameworks. Integration with HR Data and Systems A critical strength of the Agile HR Analytics platform is its ability to integrate data from multiple HR and business systems. The pre-built scenarios are only as powerful as the data that flows into them, and the platform has been designed with data integration as a core capability. The platform connects to leading HRIS systems such as Workday, SAP SuccessFactors, and ADP, extracting employee data including demographics, tenure, compensation, performance, and organizational hierarchy. It also integrates payroll systems to ensure that cost scenarios reflect actual compensation structures, including benefits, taxes, and variable pay. Survey data from engagement platforms provides insights into employee sentiment and retention risk, which inform attrition assumptions within the scenarios. This multi-source data integration is particularly valuable for global organizations operating across multiple geographies and business units. Rather than maintaining separate workforce plans for each region or division, organizations can consolidate data and scenarios at an enterprise level while maintaining the ability to drill down into specific segments. The platform’s approach to data integration emphasizes both security and governance. As discussed in detail within enterprise HR analytics strategy: a complete framework for CHROs, the platform supports role-based access control (RBAC), data isolation, and on-premises hosting options for organizations with stringent data privacy requirements. This is particularly important for regulated industries such as financial services, healthcare, and government, where data sovereignty and compliance are non-negotiable. Workforce Scenario Planning in Practice To understand the practical value of the workforce planning scenario library, consider how a global financial services organization might use it. Facing potential regulatory changes, the organization needs to explore different organizational structures and staffing
Agile HR Analytics v5.1
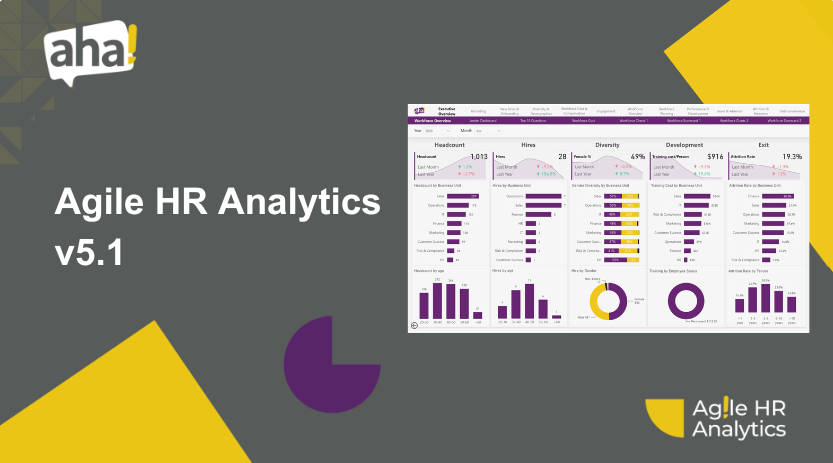
From Insight to Workforce Planning While Version 5.0 focused on creating clarity through standardization, consistency, and data reliability, Agile HR Analytics v5.1 takes the next step in the platform’s evolution: helping organizations move from understanding the workforce to planning for its future. This release introduces a new layer of workforce planning, scenario analysis, and forward-looking HR intelligence, enabling leaders to evaluate workforce risks, simulate future outcomes, and support more informed strategic decisions. https://www.youtube.com/watch?v=k5JheATB_Gw Looking Beyond Today’s Workforce Traditional HR analytics often focuses on what has happened and what is happening now. Version 5.1 expands that perspective by introducing dedicated workforce planning capabilities designed to help organizations answer questions such as: What will our future headcount look like? How might early employee exit affect workforce stability? What is the cost impact of workforce growth or reduction scenarios? Which roles may be most affected by emerging AI technologies? How can internal mobility influence workforce planning decisions? To solve these questions, a new Workforce Planning section has been introduced, creating a dedicated space for forward-looking analysis and strategic workforce decision-making. Workforce Planning as a Connected Story One of the key design goals of v5.1 was to transform workforce planning from a collection of isolated reports into a connected analytical narrative. The new planning experience guides users through a structured journey: Understanding the current workforce Identifying workforce risks and movement patterns Evaluating future workforce scenarios Assessing financial implications Exploring emerging workforce transformation opportunities This executive-focused approach helps decision-makers move naturally from observation to action. Understanding Early Exits Before They Become a Problem Employee turnover within the first year of employment can have significant organizational and financial consequences. Version 5.1 introduces a dedicated Early Exit Analysis experience, providing visibility of employee retention and workforce stability during the first twelve months of employment. The new analytics include: Retention and early-exit funnels 3, 6, 9, and 12-month exit analysis Breakdown by Business Unit, Location, Job Level, and Gender Identification of workforce segments with elevated early-exit risk By highlighting workforce vulnerabilities earlier, organizations can better understand onboarding effectiveness, employee integration, and retention challenges. Simulating Future Workforce Outcomes Planning requires more than historical reporting; it requires the ability to evaluate potential futures. Version 5.1 introduces several new projections and simulation capabilities: Headcount Projection Organizations can model scenarios for future workforce growth and reduction, assessing how workforce size may change over time. Workforce Cost Projection New projection models allow users to estimate workforce cost impacts through: Job Level Cost Projections Business Unit Cost Projections These tools enable leaders to explore alternative workforce strategies while understanding their financial implications before decisions are implemented. Early Exit Forecasting A dedicated simulation model helps estimate how future early-exit trends could affect workforce capacity and organizational stability. Together, these capabilities provide a stronger foundation for workforce planning conversations and resource allocation decisions. Understanding Workforce Movement People do not simply join and leave organizations; they move within them. To provide greater visibility into workforce dynamics, Version 5.1 introduces a new Job Mobility Analysis section. This capability helps organizations understand: Internal role movement Career progression patterns Workforce flow between organizational areas Talent mobility trends By analyzing internal movement, organizations can better evaluate talent development strategies and identify opportunities to strengthen retention through career growth. Preparing for the AI-Driven Workforce As organizations increasingly evaluate the impact of artificial intelligence on work, workforce planning must evolve accordingly. Version 5.1 introduces a new AI Impact Analysis section designed to support early discussions around: Workforce automation opportunities Role augmentation scenarios Job redesign considerations Workforce transformation planning Rather than focusing solely on technology, this analysis helps organizations explore how AI may influence workforce structures, job groups, and future talent requirements. This represents an important step toward building AI-ready workforce planning capabilities. Building Trust Through Data Quality Transparency Advanced analytics are only valuable when users trust the underlying data. To strengthen transparency and confidence, Version 5.1 introduces dedicated Data Quality pages across key dashboard sections. These pages provide visibility into: Data completeness Data consistency Validation results Analysis readiness indicators By surfacing data quality directly within the analytical experience, users can better understand the reliability of the insights they are consuming. Trust is no longer assumed; it is visible. Making the Data Model Easier to Understand Version 5.1 also expands the platform’s internal HR Dictionary, transforming it into a more comprehensive technical reference. Beyond measures and business definitions, users can now explore: Tables Columns Relationships Star Schema structures Data model components This enhancement improves transparency for analysts, developers, and administrators while supporting governance and knowledge sharing across teams. A Foundation for Smarter Workforce Decisions Version 5.1 is more than a collection of new reports. It represents a shift from descriptive HR analytics toward workforce intelligence, where organizations can evaluate risks, model future outcomes, understand workforce movement, and prepare for emerging workforce transformation. By combining planning, simulation, transparency, and data confidence within a unified experience, Agile HR Analytics continues its evolution from a reporting platform into a strategic workforce decision-support solution. Looking Ahead The journey toward intelligent workforce planning continues. Future roadmap initiatives include: More advanced forecasting and simulation models Enhanced workforce planning assumptions and scenario configuration Expanded AI impact assessments across roles and skills Automated anomaly detection and data quality monitoring Deeper predictive analytics for retention, workforce cost, and organizational planning The future of HR analytics is not only about understanding the workforce. It is about understanding what comes next and being prepared for it.

Guide to designing a finance analytics data model in Microsoft Fabric for CFOs
Introduction: Why Finance Analytics Matters in Microsoft Fabric Financial decision-making in today’s enterprise environment demands real-time insights, predictive analytics, and seamless data integration across multiple systems. For CFOs and finance teams, the ability to consolidate data from general ledger systems, accounts payable, accounts receivable, budgeting platforms, and operational systems into a unified analytics platform has become essential for competitive advantage. Microsoft Fabric represents a transformative approach to building finance analytics infrastructure. Unlike traditional data warehouse solutions that require significant engineering overhead, Fabric combines data integration, data warehousing, analytics, and AI capabilities into a single, unified platform. For finance organizations specifically, this means you can move from monthly financial close cycles to real-time financial dashboards, from static reports to dynamic, AI-powered insights, and from siloed data to enterprise-wide financial visibility. This guide addresses the critical challenge that finance leaders face: how to design a data model in Microsoft Fabric that accurately represents your financial operations while maintaining governance, security, and performance standards. We’ll walk through the complete journey from understanding your data landscape through to building executive dashboards that drive strategic decisions. Understanding Your Finance Data Landscape Mapping Your Financial Data Sources Before designing your data model, you must comprehensively understand what financial data currently exists within your organization. Most enterprises maintain financial data across multiple systems, each with different structures, update frequencies, and governance requirements. Your primary financial data sources typically include: General ledger systems (SAP, Oracle, NetSuite, Xero) containing chart of accounts, journal entries, and transaction-level details. These systems are the source of truth for financial reporting and must be treated with the highest standards of data integrity. Accounts payable and accounts receivable systems that track vendor payments, customer invoices, and cash flow. Budgeting and planning systems like Anaplan or Adaptive Insights that contain forecast data, budget allocations, and variance analysis. Fixed asset management systems tracking depreciation, asset lifecycle, and capital expenditures. Payroll and HR systems containing labor costs, headcount, and compensation data. Operational systems like CRM, ERP modules, and project management tools that generate financial impacts. When mapping these sources, document not just the system names but the data refresh frequency, data quality issues, business rules, and reconciliation requirements. This foundational work prevents costly rework during the modeling phase. Many organizations discover during this exercise that they lack clear ownership of certain data domains or that reconciliation between systems is manual and error-prone. Defining Business Requirements and KPIs The most technically sophisticated data model fails if it doesn’t answer the questions your finance team actually needs answered. Before designing any tables or relationships, conduct structured interviews with finance stakeholders to understand their key performance indicators, reporting requirements, and analytical questions. For a typical CFO organization, critical KPIs include revenue recognition and forecasting, gross margin and profitability analysis by product, customer, or business unit, cash flow forecasting and working capital management, expense analysis and cost control, budget versus actual variance analysis, and financial ratio analysis for investor relations. Document not just what metrics are needed but how they’re currently calculated, what data quality issues affect them, and what frequency they need to be refreshed. This exercise often reveals that different departments calculate the same metric differently, which your data model must address through clear definitions and centralized calculations. Assessing Data Quality and Completeness Financial data quality directly impacts decision-making quality. Before building your model, conduct a data quality assessment of your source systems. This should include identifying missing values, orphaned records, and data inconsistencies. Many finance systems contain legacy data, manual adjustments, and workarounds that must be understood and handled appropriately in your data model. Create a data quality scorecard for each source system documenting completeness (percentage of expected records present), accuracy (validation against known correct values), consistency (agreement between related fields and systems), and timeliness (how current the data is). This assessment becomes your baseline for improvement and helps set realistic expectations for stakeholders. Core Architecture Principles for Finance Data Models The Medallion Architecture Approach Microsoft Fabric’s lakehouse architecture aligns perfectly with the medallion data architecture pattern, which organizes data into bronze, silver, and gold layers. For finance data models, this structure provides clear separation of concerns and enables different governance policies at each layer. The bronze layer contains raw data ingested directly from source systems with minimal transformation. For finance, this means capturing journal entries exactly as they appear in your general ledger, invoice details from AP systems, and budget allocations from your planning system. The bronze layer serves as an audit trail and source of truth for data lineage. The silver layer applies business rules, performs data quality checks, and creates conformed dimensions. This is where you standardize chart of accounts hierarchies, reconcile duplicate customer records across systems, and apply business logic like revenue recognition rules. The silver layer is where your finance team’s domain expertise gets encoded into data structures. The gold layer contains business-ready analytics tables optimized for reporting and analysis. These are the tables that power your executive dashboards, support ad-hoc analysis, and feed into AI models. The gold layer is where you implement the dimensional model that makes complex financial analysis intuitive for business users. This architecture provides several advantages for finance teams. It maintains an immutable audit trail in bronze, enables incremental improvements to data quality in silver, and allows rapid iteration on analytics in gold without impacting source data. It also aligns with Agile Insights’ approach to designing enterprise data solutions that balance governance with agility. Dimensional Modeling for Financial Analytics Dimensional modeling, also called star schema design, is the proven approach for building analytics models that are both performant and understandable to business users. The pattern consists of fact tables containing measurable business events and dimension tables containing descriptive attributes. For finance, your primary fact table typically contains transactions at the detail level you need for analysis. This might be individual journal entries, invoice line items, or budget allocation records. Each fact table row represents a business event with associated numeric values (amounts, quantities) and foreign keys to
Guide to Securing OpenAI Integrations in Azure for Healthcare Analytics and Compliance
Healthcare organizations across Australia and globally are increasingly leveraging artificial intelligence to transform analytics, streamline operations, and improve patient outcomes. However, integrating OpenAI capabilities into Azure environments introduces significant security, compliance, and governance challenges that demand careful planning and implementation. The healthcare sector operates under some of the world’s strictest regulatory frameworks. In Australia, the Privacy Act and Australian Privacy Principles govern how health information must be handled. Internationally, HIPAA in the United States, GDPR in Europe, and equivalent frameworks elsewhere establish non-negotiable requirements for protecting sensitive health data. When combining these compliance obligations with the power of generative AI, organizations must implement defense-in-depth strategies that protect patient data while enabling innovation. This comprehensive guide walks healthcare CIOs, data architects, and compliance officers through the essential steps to secure Azure OpenAI integrations. We’ll explore network architecture, data governance, authentication mechanisms, and monitoring strategies specifically tailored for healthcare analytics scenarios. By following these practices, your organization can confidently deploy AI-powered analytics while maintaining the highest standards of security and compliance. Agile Insights has worked extensively with healthcare providers and government agencies across Australia to implement secure, compliant AI solutions. Our experience implementing Azure OpenAI and Copilot integration for analytics teams informs the practical recommendations throughout this guide. Understanding Azure OpenAI Security Fundamentals What Makes Azure OpenAI Different Azure OpenAI Service provides enterprise-grade access to OpenAI’s powerful models through Microsoft’s secure, compliant cloud infrastructure. Unlike the public OpenAI API, Azure OpenAI offers dedicated capacity, customer-managed encryption keys, and integration with Azure’s comprehensive security ecosystem. The distinction matters significantly for healthcare organizations. Azure OpenAI deployments operate within your Azure tenant, meaning your data remains under your control. You maintain ownership of your data, can implement customer-managed keys for encryption, and have the ability to configure network isolation that prevents data from traversing the public internet. Microsoft’s approach to securing Azure OpenAI emphasizes several core principles. First, data residency ensures that your health information stays within your specified geographic region. Second, encryption both in transit and at rest protects data from unauthorized access. Third, granular access controls ensure that only authorized applications and users can invoke OpenAI models. Fourth, comprehensive logging and monitoring provide visibility into all interactions with the service. Key Security Components Understanding the layered security model of Azure OpenAI helps organizations make informed architectural decisions. At the foundation, Azure provides infrastructure-level security including physical data center protection, network isolation, and hypervisor security. Above that sits Azure’s identity and access management layer, which controls who and what can access OpenAI resources. The service layer itself incorporates content filtering to prevent misuse, rate limiting to protect against abuse, and audit logging to track all activity. Finally, application-level security depends on how your healthcare organization implements the integration, including data anonymization, prompt engineering practices, and response validation. According to Microsoft’s guidance on creating better healthcare outcomes with Azure OpenAI Service, healthcare providers using Azure OpenAI for streamlining clinical tasks and accelerating research must implement security controls at each of these layers to ensure patient data protection. Healthcare Compliance Requirements for AI Integration HIPAA and Protected Health Information Healthcare organizations in the United States operating under HIPAA must ensure that any AI system processing Protected Health Information (PHI) meets strict requirements. These requirements extend beyond simple encryption to encompass data use agreements, breach notification procedures, and comprehensive audit controls. When integrating OpenAI into Azure for healthcare analytics, HIPAA compliance requires several specific measures. First, any data sent to OpenAI models must be either de-identified according to HIPAA standards or processed through a Business Associate Agreement (BAA). Microsoft has published Business Associate Agreements for Azure OpenAI Service, but your organization must execute these agreements and understand their scope. Second, HIPAA requires that you maintain audit logs showing who accessed what data and when. Azure provides comprehensive logging through Azure Monitor and Azure Log Analytics, enabling healthcare organizations to track all interactions with OpenAI models. These logs must be retained according to your organization’s policies and regulatory requirements. Third, HIPAA mandates encryption of PHI both in transit and at rest. Azure OpenAI supports encryption in transit through TLS 1.2 or higher, and at rest through either Microsoft-managed keys or customer-managed keys stored in Azure Key Vault. For healthcare organizations handling the most sensitive data, customer-managed encryption keys provide additional control and compliance assurance. Australian Privacy Principles and Local Compliance Australian healthcare organizations must comply with the Privacy Act and the Australian Privacy Principles (APPs), which establish principles for how personal information including health information must be handled. APP 1 requires that organizations manage personal information held by them in an open and transparent way, while APP 13 specifically addresses health information. When implementing Azure OpenAI for healthcare analytics in Australia, ensure that your architecture and policies align with these principles. This includes implementing data minimization practices, where you process only the health information necessary for your analytics objectives. It also requires transparency with patients about how their data is used in AI systems. Data sovereignty is particularly important for Australian organizations. Ensure that your Azure OpenAI deployment is configured to keep health data within Australia or your specified geographic region. Azure provides regional deployment options that allow you to meet data residency requirements while still accessing OpenAI capabilities. GDPR and International Compliance Organizations operating across multiple jurisdictions must consider GDPR requirements for European data subjects and equivalent frameworks in other regions. GDPR’s requirements around data minimization, purpose limitation, and the right to explanation create additional considerations for AI system design. When designing healthcare analytics with Azure OpenAI, implement data minimization by processing only the minimum health information necessary to achieve your analytics objectives. Document your lawful basis for processing health data through OpenAI systems. Implement technical measures to ensure that individuals can understand how AI systems are making decisions about their health data. The official HHS guidance on AI and HIPAA emphasizes that organizations must consider both the security of AI systems and their compliance with privacy principles. This holistic approach is essential for healthcare analytics in

How Fabric OneLake Differs from Traditional Azure Data Lake Implementations
Understanding the Evolution of Data Lake Architecture The journey from traditional data management to cloud-native analytics has fundamentally reshaped how enterprises think about data storage and accessibility. For years, organizations relied on Azure Data Lake Storage (ADLS) as their primary solution for handling massive volumes of unstructured and semi-structured data. However, the introduction of Microsoft Fabric and its core component, OneLake, represents a paradigm shift in how data lakes are architected, managed, and consumed across organizations. At Agile Insights, we work with Australian enterprises navigating this transition, helping them understand not just the technical differences between OneLake and traditional Azure Data Lake implementations, but more importantly, how these differences translate into tangible business value. This comprehensive guide explores the architectural distinctions, governance implications, cost considerations, and practical benefits that make OneLake a compelling evolution for organizations modernizing their data platforms. Before diving into the specific differences, it’s crucial to understand that OneLake isn’t simply a replacement for Azure Data Lake Storage Gen2. Rather, it’s a reimagined approach to data lake design that builds upon ADLS Gen2 foundations while introducing a unified, tenant-level abstraction layer that fundamentally changes how organizations manage and consume data across their enterprise. The Architectural Foundation: OneLake vs. Traditional ADLS Traditional Azure Data Lake implementations typically involve creating multiple storage accounts within Azure Data Lake Storage Gen2, each serving specific departments, projects, or business units. This distributed approach offers flexibility and allows teams to maintain autonomous control over their data silos. However, this autonomy comes at a cost: data fragmentation, inconsistent governance policies, and complex integration patterns. OneLake, as explained in Microsoft’s official documentation, operates as a logical data lake built on top of Azure Data Lake Storage Gen2. Unlike traditional ADLS implementations where organizations manage multiple physical storage accounts, OneLake provides a single, unified logical data lake per Fabric tenant. This represents a fundamental architectural shift from a “many storage accounts” model to a “one logical lake” paradigm. Think of it this way: traditional Azure Data Lake implementations are like having multiple separate warehouses scattered across different locations, each with its own management system, security protocols, and inventory management. OneLake, by contrast, is like having one unified warehouse with intelligent partitioning and organization that appears as a single entity to all users and applications, regardless of where the underlying physical storage resides. According to detailed comparisons of OneLake’s logical structure versus multiple ADLS Gen2 storage accounts, the key architectural distinction lies in how workspaces function as containers. In traditional ADLS setups, storage accounts are the primary organizational unit, often requiring complex cross-account authentication and data movement between teams. OneLake abstracts this complexity by organizing data within workspaces, which sit within a single tenant-level logical structure. This means users can seamlessly access data across the organization without managing multiple storage account credentials or complex networking configurations. Storage Account Proliferation vs. Unified Tenant Architecture Traditional Azure Data Lake implementations often result in storage account proliferation. A mid-sized organization might have 10, 20, or even 50+ storage accounts, each representing different departments, projects, or data domains. Managing this sprawl creates several challenges: Authentication complexity: Users need separate credentials or role assignments for each storage account Data movement overhead: Moving data between accounts requires explicit copy operations and data pipeline orchestration Governance inconsistency: Each storage account can have different access policies, encryption standards, and retention rules Cost visibility: Understanding total storage costs requires aggregating billing across multiple accounts Integration fragmentation: Applications and analytics tools must be configured to connect to multiple endpoints OneLake eliminates this proliferation by providing a single tenant-level logical data lake. All data, regardless of which team created it or which business unit owns it, exists within the same logical structure. This doesn’t mean all data is physically co-located or that security boundaries disappear; rather, it means the organizational structure is unified from a user perspective. The Role of Workspaces in OneLake Organization Within OneLake, workspaces serve as the primary organizational containers. Each workspace in Microsoft Fabric contains its own OneLake instance, which acts as a dedicated logical data lake for that workspace. This is fundamentally different from traditional ADLS, where storage accounts serve as the organizational boundary. Workspaces in OneLake provide several advantages over traditional storage account organization: Consistent governance framework: All data within a workspace inherits consistent metadata, security policies, and data lineage tracking Simplified access management: Role-based access control applies consistently across all data in the workspace Integrated analytics: Power BI, SQL analytics endpoints, and other Fabric components natively understand the workspace structure Unified data discovery: Tools like Microsoft Fabric’s AI-powered catalog provide consistent discovery across all workspace data Governance and Metadata Management: A Critical Differentiator One of the most significant practical differences between OneLake and traditional Azure Data Lake implementations emerges in governance and metadata management. Traditional ADLS implementations require external governance layers, often using tools like Microsoft Purview, to track data lineage, ownership, and sensitivity classifications across storage accounts. OneLake, by contrast, has governance embedded into its architecture from the ground up. Every item stored in OneLake carries metadata about its creation, modification, ownership, and sensitivity classification. This isn’t bolted on as an afterthought; it’s fundamental to how OneLake organizes and presents data. The key architectural differences between Azure Data Lake and OneLake highlight how OneLake’s integrated approach to metadata management reduces the operational burden of governance. In traditional ADLS implementations, governance teams must actively scan storage accounts, catalog files, and maintain metadata repositories. With OneLake, this metadata is automatically captured and made available through Fabric’s unified interface. For organizations implementing data governance frameworks, this difference is profound. Consider a typical scenario: a financial services organization needs to track all datasets containing customer personally identifiable information (PII) for compliance purposes. In a traditional ADLS environment, this requires: Regular scans of all storage accounts using data discovery tools Manual or semi-automated classification of discovered data Maintenance of a separate metadata repository Regular audits to ensure classifications remain accurate Complex reporting to demonstrate compliance With OneLake and integrated governance, much of this process is automated. Data classifications

How Microsoft Purview Automated Data Lineage Works with Fabric Pipelines
Understanding Data Lineage in Modern Analytics Environments Data lineage represents the complete journey of information as it moves through an organization’s analytics infrastructure. In traditional enterprise environments, tracking this journey manually has been a significant challenge, often requiring spreadsheets, documentation, and institutional knowledge that quickly becomes outdated. When data flows through multiple systems, transformations, and pipelines, understanding where information originates, how it is processed, and where it ultimately lands becomes increasingly critical for governance, compliance, and operational efficiency. Microsoft Purview addresses this challenge by providing automated data lineage capabilities that work seamlessly with Microsoft Fabric pipelines. For organizations in Australia and across the Asia-Pacific region evaluating modern data platforms, understanding how these two Microsoft technologies integrate is essential for building robust, governable analytics foundations. Data lineage serves multiple critical functions within an enterprise. From a compliance perspective, regulators and internal audit teams need to understand data flows to ensure privacy regulations like the Privacy Act 1988 (Cth) are respected. From a data quality standpoint, when downstream analytics or reports show unexpected results, tracing lineage helps identify where quality issues originated. From an operational perspective, lineage enables teams to understand dependencies between data assets, making it easier to plan maintenance windows, assess the impact of schema changes, and optimize pipeline performance. The Role of Microsoft Purview in Data Governance Microsoft Purview functions as a unified data governance solution that extends across the Microsoft cloud ecosystem. At its core, Purview provides a centralized catalog where organizations can register, discover, and understand all their data assets. The platform combines three primary capabilities: the data map, which tracks metadata and lineage; the data catalog, which enables asset discovery and business context; and the data estate insights, which provides governance dashboards and compliance reporting. When integrated with Microsoft Fabric, Purview automatically captures lineage information without requiring manual configuration or custom scripts. This automation represents a significant operational advantage over legacy approaches where data engineers had to manually document lineage or implement custom solutions. The automated lineage capabilities in Purview extend to Fabric workloads, automatically registering metadata from Fabric items including Lakehouses, Data Factories, and notebooks. Purview’s integration with Fabric addresses a critical gap in many organizations’ governance strategies. Teams often maintain separate tools for data cataloging, lineage tracking, and governance reporting, creating silos and increasing operational overhead. By consolidating these functions within a single platform that understands Fabric’s architecture, organizations can achieve more comprehensive governance with less manual effort. For CIOs and Heads of Data and Analytics at mid-to-large Australian enterprises, Purview provides the governance foundation necessary to scale analytics initiatives while maintaining compliance with local privacy requirements and international data standards. The platform’s ability to automatically capture lineage from Fabric pipelines means governance teams gain visibility without placing additional burden on data engineering teams. How Fabric Pipelines Generate Metadata for Purview Microsoft Fabric pipelines are the orchestration backbone of modern analytics workflows. These pipelines coordinate complex data movements, transformations, and integrations across multiple systems and data sources. A typical Fabric pipeline might extract data from on-premises databases, cloud data sources, and SaaS applications; perform transformations using Spark, SQL, or Python; and load processed data into Lakehouses or Data Warehouses for consumption by analytics teams. As Fabric pipelines execute, they generate rich metadata that describes their structure and execution. This metadata includes information about the pipeline’s activities, their sequence, the data sources they read from, the destinations they write to, and the transformations they perform. Fabric automatically captures this metadata and makes it available to Purview through a built-in integration. The key mechanism enabling this integration is Fabric’s automated metadata emission. When you create a Fabric pipeline that reads from a source system, performs transformations, and writes to a Lakehouse, Fabric records this entire flow as structured metadata. This metadata includes the pipeline name, activities, connections used, and the specific Lakehouse tables or folders that serve as inputs and outputs. Unlike custom lineage solutions that require developers to instrument code or implement tracking logic, Fabric’s native metadata generation is automatic and requires no additional configuration. This approach significantly reduces implementation complexity and ensures that lineage information remains current as pipelines evolve. When a data engineer modifies a pipeline activity or adds a new transformation step, the metadata automatically reflects these changes. Fabric’s integration with Purview means this metadata flows directly into Purview’s data map without manual intervention. Organizations scanning their Fabric tenant in Purview automatically gain lineage visibility across all Fabric items. This automated approach contrasts sharply with approaches requiring custom code, OpenLineage implementations, or manual documentation, all of which introduce maintenance overhead and risk of lineage drift. The Scanning Process: From Fabric to Purview The process of bringing Fabric metadata and lineage into Purview begins with configuring a Purview scan targeting your Fabric tenant. This scanning process is straightforward and requires minimal configuration compared to scanning traditional data sources. When you configure a Fabric scan in Purview, you specify the Fabric capacity or workspace you want to scan, and Purview handles the rest. During the scan, Purview connects to your Fabric tenant using appropriate credentials and permissions. It then discovers all Fabric items including Lakehouses, Data Warehouses, Data Factories, Notebooks, and Semantic Models. For each item, Purview extracts metadata including names, descriptions, ownership information, and lineage relationships. The lineage extraction is particularly sophisticated. When Purview scans a Fabric Data Factory pipeline, it doesn’t simply record that the pipeline exists. Instead, it traces the data flow through the pipeline, identifying each activity, understanding the transformations performed, and capturing the connections between source systems, intermediate processing steps, and destination assets. This means the lineage captured in Purview reflects the actual data flow logic encoded in the pipeline. For Fabric Lakehouses, Purview captures metadata about tables, columns, and the relationships between Lakehouse tables and the pipelines that populate them. This column-level lineage is particularly valuable for compliance teams and data quality engineers who need to understand not just which tables are related, but which specific columns flow from source to destination through transformation steps. The scanning process

AI Workforce Intelligence for the Public Sector: Bridging HR and IT with Microsoft
Public sector organisations are experiencing a major shift in how they manage, understand, and act on workforce data. As workforce pressures intensify and digital transformation accelerates, HR and IT teams are being pushed into closer collaboration than ever before. Both functions are now expected to improve workforce visibility, reduce reporting complexity, modernise legacy analytics environments, accelerate decision making, and maximise existing Microsoft investments. Yet most workforce analytics environments were built for reporting, not operational execution. Why Public Sector Organisations Are Reassessing Workforce Analytics Workforce intelligence has evolved from a back-office reporting function into a strategic capability that affects the entire organisation. HR teams are under pressure to improve workforce planning, retention visibility, recruitment forecasting, and operational responsiveness. At the same time, IT teams are increasingly involved because workforce intelligence now touches governance, security, infrastructure, integration, and AI strategy. This creates tension. HR wants faster answers and more agility. IT wants governance, security, and reduced platform sprawl. Traditional dashboard centric analytics environments often sit awkwardly between these two priorities. They introduce additional SaaS platforms, new integrations, more governance overhead, and higher operating costs. As a result, public sector organisations are looking for a new model that supports both agility and control. Bridging HR and IT Through Microsoft The public sector does not need another disconnected analytics platform. What it needs is workforce intelligence that fits naturally within its existing enterprise technology strategy. This is where Microsoft becomes a powerful unifying force. Most public sector organisations already operate within Azure, Fabric, Power BI, and Microsoft’s security frameworks. Aha! extends these investments rather than adding a new standalone environment. This alignment gives HR faster insights, self service capability, AI driven answers, and improved operational visibility. IT benefits from existing governance, existing security controls, reduced SaaS sprawl, and lower operational complexity. Instead of being an HR procurement conversation, workforce intelligence becomes a shared transformation initiative. Moving Beyond Dashboards Dashboards were an important first step in workforce analytics, but they still rely heavily on analysts, interpretation, reporting cycles, and manual explanation. In the public sector, this creates bottlenecks and slows down decision making. Leaders today want immediate answers, real time visibility, and simple access to insights. They no longer want to request a report or wait for an analyst to interpret a dashboard. They want to ask questions such as: Where are we seeing workforce pressure Where is attrition risk increasing Which units are struggling with recruitment Where is overtime rising What might impact service delivery And they expect instant, AI generated responses that highlight risks and recommend actions. This is the shift toward AI Agent First Workforce Intelligence. The Rise of Self-Service Workforce Intelligence Analytics teams across the public sector are stretched thin. The challenge is no longer just producing reports but enabling the entire organisation to access and use workforce intelligence. Self-service models allow executives, HR leaders, operational leaders, and department managers to interact directly with insights. This reduces reporting dependency, lowers manual workload, and speeds up decision making. Most importantly, it increases adoption. People engage more naturally with conversational questions and answers than with complex dashboards. Why Microsoft Alignment Matters Public sector organisations face ongoing pressure to rationalise technology, reduce complexity, improve governance, and maximise existing investments. Aha! is built entirely within Azure, Fabric, Power BI, and Azure OpenAI, which means no net new SaaS platform and no movement of workforce data outside the organisation’s tenant. This significantly reduces procurement friction, security reviews, and long-term operating costs. It also ensures HR and IT are working from the same technology strategy, which is becoming a major differentiator in the market. The Future of Workforce Intelligence The future of public sector workforce intelligence is not more dashboards or more reporting. It is AI enabled operational decision making. Organisations that move early will benefit from faster workforce decisions, AI assisted insight delivery, self-service operating models, and secure enterprise-wide intelligence capability. This leads to better workforce visibility, improved operational responsiveness, lower technology overhead, stronger HR and IT alignment, and ultimately better service delivery outcomes. See It in Action Watch our full webinar, which includes a demonstration of our platform, showing exactly how AI agent driven workforce intelligence works in practice and what moving beyond dashboards truly looks like. For organisations exploring this journey, Aha! offers tailored demonstrations, public sector use case deep dives, alignment to Microsoft strategy, and low risk proof of concept pathways. The shift is already underway. The question is which organisations will lead it.

Agile HR Analytics Compliance Readiness for GDPR and HIPAA-Regulated Enterprises
Overview and First Impressions Agile HR Analytics has emerged as a compelling solution for enterprise organizations navigating the complex intersection of people analytics and regulatory compliance. In an era where data protection regulations like GDPR and HIPAA have become non-negotiable requirements, HR leaders face mounting pressure to implement analytics platforms that deliver actionable workforce insights without compromising employee privacy or exposing their organizations to regulatory penalties. Our comprehensive review of Agile HR Analytics reveals a platform thoughtfully architected around compliance-first principles. Built on the Microsoft stack including Power BI, Azure, and Azure OpenAI, the platform demonstrates a clear understanding of enterprise security requirements and data governance challenges. What immediately stands out is the platform’s flexibility in deployment options and its emphasis on role-based access controls (RBAC), data isolation, and local hosting capabilities. For CHROs and senior HR leaders evaluating enterprise HR analytics solutions, Agile HR Analytics presents a refreshingly transparent approach to compliance. Rather than treating regulatory requirements as afterthoughts, the platform integrates compliance considerations into its core architecture. This approach resonates particularly well with organizations operating across multiple jurisdictions or handling sensitive employee health information subject to HIPAA regulations. The platform’s rapid deployment capability is another notable strength. Many enterprise analytics implementations drag on for months or years, but Agile HR Analytics leverages pre-built data models and ready-to-use dashboards to accelerate time-to-value. This acceleration doesn’t come at the expense of security or compliance, which represents a significant achievement in the analytics platform landscape. Compliance Architecture and Regulatory Framework When evaluating Agile HR Analytics for regulated enterprises, understanding the platform’s compliance architecture is essential. The solution has been designed with multiple regulatory frameworks in mind, though the most critical for HR departments are GDPR and HIPAA. GDPR compliance for HR data presents unique challenges because, as explained in detail through resources on The GDPR Covers Employee/HR Data and It’s Tricky, employee data falls squarely within the regulation’s scope, requiring careful handling of sensitive personal information, data processing agreements, and data protection impact assessments. Agile HR Analytics addresses these requirements through its data isolation capabilities and support for on-premises hosting, allowing organizations to maintain data sovereignty and control over personal information processing. HIPAA compliance, meanwhile, applies to employers sponsoring health plans or wellness programs. According to comprehensive guidance on HIPAA Compliance for HR Departments, HR departments must implement robust safeguards for protected health information (PHI), including administrative, physical, and technical controls. Agile HR Analytics supports HIPAA compliance through its implementation of role-based access controls, audit logging capabilities, and secure data transmission protocols. The platform’s architecture leverages Azure’s compliance certifications and built-in security features. Azure itself maintains certifications for both GDPR and HIPAA, providing a foundational layer of compliance infrastructure. Organizations using Agile HR Analytics can inherit these certifications while adding their own organizational controls and policies on top. One particularly important aspect of compliance is understanding the differences between GDPR and HIPAA requirements. As detailed in GDPR vs HIPAA: A Comprehensive Compliance Guide, these regulations differ significantly in scope, enforcement mechanisms, and penalties. GDPR applies broadly to any organization processing personal data of EU residents, while HIPAA specifically targets healthcare organizations and health plan sponsors. Agile HR Analytics recognizes these distinctions and provides configuration options appropriate for each regulatory context. Data Protection and Security Features Agile HR Analytics implements a multi-layered approach to data protection that extends beyond basic encryption. The platform addresses the critical requirement to Protecting HR Data: Risks and Regulatory Requirements through comprehensive technical and administrative controls. Role-based access control (RBAC) represents one of the platform’s strongest security features. Rather than providing blanket access to all HR data, RBAC allows organizations to define granular permissions based on job function, department, and organizational hierarchy. A compensation analyst might have access to pay equity analytics without seeing individual employee health information, while a talent manager could access attrition prediction models without viewing payroll data. This segmentation principle aligns directly with regulatory requirements for data minimization and the principle of least privilege. Data isolation capabilities further strengthen the security posture. Organizations can implement logical or physical separation of sensitive datasets, ensuring that different data categories remain segregated within the analytics platform. This approach proves particularly valuable for organizations managing both general HR analytics and health-related information subject to HIPAA restrictions. The platform’s support for on-premises hosting addresses a critical concern for regulated enterprises. While cloud deployment offers convenience and scalability, some organizations require local data residency for compliance or strategic reasons. Agile HR Analytics accommodates this requirement through deployment options that allow organizations to host the platform on their own infrastructure while maintaining full functionality and compliance capabilities. Audit logging and activity monitoring provide the transparency necessary for compliance verification. The platform maintains detailed logs of who accessed which data, when access occurred, and what actions were taken. These audit trails prove essential during compliance audits and investigations of potential data breaches. Encryption protections extend across data in transit and at rest. Data transmitted between client systems and the analytics platform is encrypted using industry-standard protocols, while stored data is encrypted using Azure’s encryption services. This dual-layer encryption approach ensures that even if data were somehow intercepted or accessed without authorization, it would remain unreadable without the appropriate encryption keys. GDPR Compliance Capabilities For organizations operating in Europe or processing data of EU residents, GDPR compliance is non-negotiable. Agile HR Analytics provides several features specifically designed to support GDPR requirements. Data subject access rights represent a fundamental GDPR requirement. Individuals have the right to access their personal data and understand how it’s being processed. Agile HR Analytics supports this through its data integration capabilities and audit logging. Organizations can quickly identify what personal data is stored, how it’s being analyzed, and what insights are being generated from it. Data protection impact assessments (DPIAs) are required before implementing new processing activities that could pose high risk to individuals’ rights and freedoms. The platform’s transparent architecture and clear documentation of data flows facilitate the DPIA process. Organizations can map how employee data flows from

XAHA Availability and Disaster Recovery Options for Critical HR Operations
Overview and First Impressions When evaluating enterprise HR analytics solutions, availability and disaster recovery capabilities often take a backseat to feature discussions. However, for organizations managing mission-critical HR operations, understanding how your AI-powered HR assistant handles outages, data loss, and system failures is non-negotiable. This comprehensive review examines XAHA (the AI assistant component of Agile HR Analytics) and its availability and disaster recovery options, particularly for CHROs and senior HR leaders responsible for ensuring continuous access to workforce insights. XAHA represents a significant advancement in how organizations leverage artificial intelligence for HR decision-making. Built on the Microsoft stack including Azure OpenAI, XAHA delivers conversational AI capabilities that enable HR teams to extract insights from complex workforce data without requiring deep technical expertise. However, the sophistication of this AI-powered system introduces operational considerations that extend beyond traditional HR analytics dashboards. Our review focuses on a critical gap in many enterprise software discussions: what happens when XAHA becomes unavailable? For organizations in regulated industries managing global workforces, the answer to this question directly impacts compliance timelines, talent decisions, and organizational continuity. We’ve examined Agile HR Analytics’ deployment architecture, redundancy options, and recovery mechanisms to provide CHROs and IT leaders with the clarity needed to make informed decisions about implementing this solution in their critical HR infrastructure. Understanding XAHA’s Architecture and Deployment Models Before diving into availability specifics, it’s essential to understand how XAHA operates within the broader Agile HR Analytics platform. XAHA functions as a conversational interface to your HR data, powered by Azure OpenAI and built on the Microsoft cloud infrastructure. The architecture separates the AI assistant layer from the underlying data platform, which means availability considerations span multiple components. Agile HR Analytics offers flexibility in deployment models, which directly impacts your disaster recovery posture. Organizations can deploy on Microsoft Azure (cloud-native), leverage Microsoft Fabric for integrated analytics, or implement on-premises solutions for enhanced data sovereignty. This architectural flexibility is particularly valuable for enterprise organizations in regulated industries where data residency requirements or compliance mandates necessitate local hosting options. The platform integrates HR, payroll, and survey data through pre-built data models and connectors, creating a unified data foundation that XAHA queries to generate insights. Understanding this data flow is critical for disaster recovery planning, as your recovery strategy must account for data freshness, model dependencies, and query performance during recovery scenarios. When you’re exploring workforce planning strategy for global organizations, XAHA’s availability becomes directly relevant to your ability to make time-sensitive talent decisions across multiple regions and time zones. A single point of failure in your AI assistant could delay critical workforce decisions affecting thousands of employees. High Availability vs. Disaster Recovery: What You Need to Know One of the most common misconceptions in enterprise IT is treating high availability (HA) and disaster recovery (DR) as interchangeable concepts. They’re not. Understanding the distinction is fundamental to evaluating XAHA’s operational resilience. High availability focuses on eliminating single points of failure within a system, ensuring continuous operation through redundancy, load balancing, and automatic failover mechanisms. A highly available system might survive hardware failures, network issues, or individual component degradation without user-visible downtime. High availability is about preventing problems from causing service interruptions. Disaster recovery, by contrast, addresses major infrastructure events that exceed the scope of high availability protections. DR strategies involve recovery procedures, backup systems, and documented processes for restoring service after catastrophic failures. Where high availability prevents downtime, disaster recovery minimizes it when prevention fails. For XAHA, this distinction matters enormously. High availability might involve Azure’s built-in redundancy across availability zones, ensuring that if one data center experiences issues, your AI assistant continues operating seamlessly. Disaster recovery, however, addresses scenarios like region-wide outages, widespread data corruption, or security incidents requiring complete service restoration. The most resilient infrastructure implements both approaches simultaneously, creating layered protection. Agile HR Analytics’ architecture supports this layered approach through multiple deployment options and built-in redundancy mechanisms. When you’re implementing HR analytics dashboards in Power BI alongside XAHA, understanding these distinctions helps you design appropriate monitoring and failover procedures. A dashboard might remain accessible even if XAHA becomes temporarily unavailable, providing partial continuity while your AI assistant recovers. XAHA Availability Features and Redundancy Options Agile HR Analytics implements several availability mechanisms designed to keep XAHA operational during common failure scenarios. These features address the most frequent causes of service interruption without requiring complete disaster recovery activation. Azure-Native Redundancy When deployed on Microsoft Azure, XAHA benefits from Azure’s built-in high availability infrastructure. Azure maintains multiple data centers within each region, with automatic failover mechanisms that detect failures and redirect traffic within milliseconds. This means that hardware failures, network issues, or individual server problems typically resolve without any user awareness. The platform implements stateless AI processing, which is crucial for availability. XAHA’s queries don’t depend on local state stored on specific servers; instead, they operate against your centralized data models and HR data repositories. This architectural choice enables rapid failover without data consistency concerns. Load Balancing and Redundant Endpoints Agile HR Analytics distributes XAHA queries across multiple compute instances, with intelligent load balancing routing requests to available resources. This prevents any single instance from becoming a bottleneck and ensures that temporary performance degradation on one instance doesn’t impact overall availability. For organizations requiring enhanced redundancy, multi-region deployment options distribute XAHA instances across geographically separated Azure regions. This protects against region-wide outages and provides improved response times for global teams by routing requests to the nearest available instance. Health Monitoring and Automatic Recovery The platform continuously monitors XAHA’s operational health, tracking metrics like query response times, error rates, and resource utilization. When the system detects degradation, automated recovery procedures attempt to restore normal operation without manual intervention. This might involve restarting services, reallocating compute resources, or triggering failover to redundant instances. Disaster Recovery Capabilities and Recovery Objectives While high availability handles routine failures, disaster recovery addresses catastrophic scenarios requiring restoration from backups or alternate systems. Agile HR Analytics provides multiple disaster recovery options tailored to different organizational risk profiles. Recovery Time Objective (RTO) and Recovery

Moving Beyond Dashboards: How AI Agents Are Redefining Workforce Intelligence
Most organizations don’t have a workforce data problem. They have an access-to-insight problem. Every day, HR leaders are asked critical questions: Where are we losing key talent? Which teams are at highest attrition risk? Is hiring keeping up with business demand? Where are workforce gaps impacting productivity? Yet in most organizations, answering those questions still requires analysts pulling reports, manipulating dashboards, and manually translating data into recommendations. By the time the answer arrives, the decision window has often already passed. This is the quiet limitation of the traditional dashboard model, not a technology failure, but an operational one. Dashboards Were Built for Reporting – Not Decision-Making For years, workforce analytics has centered around dashboards. Build a visualization. Share a report. Create filters. Publish another page. But dashboards still require interpretation. Business leaders rarely want to navigate layers of reporting logic or wait for analysts to explain what the charts actually mean. The result is a familiar cycle: A leader asks a question HR or analytics teams build a report Data gets translated into a narrative Recommendations arrive hours or days later That delay creates friction between the business question and the business action. The issue isn’t the quality of the data. The issue is the interface between people and insight. The Hidden Cost of Traditional People Analytics Platforms When organizations realize dashboards aren’t delivering enough value, the default response is often to purchase another workforce analytics platform. And while many traditional vendors provide strong reporting capabilities, they also introduce new challenges: Data duplication across environments Additional governance and security complexity Long implementation timelines Ongoing licensing costs Another SaaS platform for IT to manage Low long-term adoption outside analytics teams More organizations are now asking a different question: Why invest in another external platform when the infrastructure already exists internally? Your Microsoft Ecosystem Already Has the Foundation Most mid-to-large enterprises already operate on a powerful data foundation: Microsoft Azure Microsoft Fabric Power BI Enterprise data lakes Existing governance and security frameworks What’s often missing isn’t more dashboards. It’s an intelligence layer that can interpret workforce data in real time. Instead of: Buying another platform → moving data → building reports Organizations are shifting toward: Activating existing workforce data → leveraging AI agents → receiving immediate answers This changes the economics of workforce intelligence entirely. IT retains governance and control HR gains immediate access to insights CFOs avoid unnecessary platform spend Business leaders move faster And critically – the data never has to leave the organization’s existing environment. From Dashboards to Answers The real transformation is not visual. It’s conversational. Instead of opening a dashboard and applying filters, leaders simply ask: “Where are our biggest workforce risks?” “Which business units are struggling with retention?” “Are promotions keeping pace with growth?” “What regions are under-resourced?” An AI agent interprets the request, scans workforce data in real time, identifies patterns and anomalies, and returns structured insights instantly. Not just metrics. Direction. The interface becomes the conversation itself. Why This Matters to Both HR and IT Historically, workforce analytics has forced a compromise between HR and IT. HR wanted speed and accessibility. IT wanted governance and control. Modern AI-driven workforce intelligence allows organizations to achieve both simultaneously. Because analytics operates within the existing Microsoft environment: IT maintains security, permissions, and governance HR gains direct access to actionable insights Data remains inside the tenant Existing investments in Fabric, Power BI, and Azure are fully leveraged This is no longer about replacing dashboards. It’s about extending enterprise intelligence. The Organizations Winning with AI Aren’t Buying More Tools They’re activating the infrastructure they already own. The future of workforce intelligence is not another reporting layer. It’s an AI-powered system of insight that connects workforce data to operational and business outcomes in real time. The organizations moving fastest are doing so because: Decision-making accelerates Analyst dependency decreases Adoption improves Time-to-insight collapses Cost structures improve dramatically Most importantly, leaders stop waiting for reports – and start acting on insight immediately. Ready to Move Beyond Dashboards? If your organization is already invested in Microsoft and looking to modernize workforce intelligence without introducing another SaaS platform, now is the time to rethink the model. At Aha!, we help organizations move from static dashboards to AI-driven workforce intelligence, leveraging AI agents inside your existing Microsoft ecosystem to deliver immediate, actionable insights. What this means for your organization: Faster workforce decisions AI-driven insights in seconds Reduced dependency on manual reporting Enterprise-grade governance and security A fraction of the cost of traditional vendors No need to increase analytics headcount If you’d like to see what this looks like in practice, book a personalized demo directly with me and explore how organizations are transforming workforce analytics with AI. Book a demo today and see how Aha! is helping enterprises move from dashboards to answers.

Build a Manager Approval Workflow Triggered from Power BI Reports Using XAHA Actions
Introduction In modern enterprise HR organizations, approval workflows are the backbone of governance and compliance. Whether you’re managing compensation adjustments, headcount requests, or workforce planning decisions, having a streamlined approval process directly integrated into your analytics platform can dramatically reduce bottlenecks and accelerate decision-making. Agile HR Analytics (AHA!) combines the power of AI-driven insights with actionable workflows through XAHA, our AI assistant built on the Microsoft stack. This tutorial walks you through building a manager approval workflow that’s triggered directly from Power BI reports, enabling your HR teams to take action on data-driven insights without leaving the dashboard environment. By the end of this guide, you’ll understand how to connect Power BI, Power Automate, and XAHA to create a seamless approval experience that transforms HR analytics from passive reporting into active decision-making. This approach is particularly valuable for enterprise and global organizations in regulated industries, where audit trails, role-based access, and transparent governance are non-negotiable requirements. Prerequisites and Setup Requirements Before you begin building your manager approval workflow, ensure you have the following components in place: Licensing and Access Requirements You’ll need appropriate Microsoft 365 and Power Platform licensing to support this workflow. At minimum, you should have Power BI Premium or Power BI Pro licenses for your analytics team, along with Power Automate licenses for those creating and managing workflows. For enterprise deployments, consider Power Automate per-flow plans, which provide better cost scalability across multiple workflows. Ensure your organization has Azure and Azure OpenAI access if you’re leveraging XAHA for intelligent action recommendations. Your Agile HR Analytics instance should be provisioned with appropriate role-based access controls (RBAC) configured at the data level. This is critical for ensuring managers only see and approve actions relevant to their organizational scope. Data Integration Prerequisites Your HR, payroll, and relevant business data must be integrated into your Agile HR Analytics platform. If you haven’t completed this step, review our detailed guide on how to integrate HR, payroll and survey data for people analytics to ensure your data foundation is solid. Your Power BI reports should already be connected to your Agile HR Analytics data models. We recommend building your approval workflow around pre-built data models that align with your approval scenarios. For example, if you’re approving compensation adjustments, ensure your data model includes salary bands, current compensation, proposed adjustments, and manager hierarchy information. Power BI and Power Automate Configuration You’ll need a Power BI workspace where your reports are published. This workspace should have appropriate sharing permissions configured, allowing managers to access reports relevant to their organizational scope. Additionally, ensure your Power BI service is configured to allow Power Automate integration. This requires enabling the Power Automate visual in your Power BI tenant settings. Create a dedicated Power Automate environment for your HR workflows. This helps maintain governance, audit trails, and clear separation of concerns. Document the environment URL and connection details, as you’ll reference these throughout the workflow setup process. Security and Compliance Considerations Before implementing approval workflows, assess your organization’s data governance requirements. If you’re operating in regulated industries or geographies with strict data residency requirements (GDPR, CCPA), ensure your Power Automate flows and underlying data are deployed in compliant regions. Agile HR Analytics supports on-premises hosting options and local data isolation, which may be critical for your approval workflow architecture. Document your approval hierarchy and ensure it aligns with your organizational structure in your HRIS system. Manager relationships should be synchronized regularly to prevent approval requests from being routed to incorrect stakeholders. Understanding the Approval Workflow Architecture Before diving into configuration, it’s important to understand how the components work together in your approval workflow. How Power BI, Power Automate, and XAHA Integrate Your approval workflow operates across three primary layers: the presentation layer (Power BI), the orchestration layer (Power Automate), and the intelligence layer (XAHA with Azure OpenAI). When a manager interacts with a Power BI report and triggers an action through XAHA, that action initiates a Power Automate workflow. The workflow routes the approval request to the appropriate stakeholder, captures their decision, and updates your underlying data systems accordingly. XAHA serves as the intelligent intermediary in this architecture. Rather than requiring managers to manually construct approval requests, XAHA analyzes the context from the Power BI report and generates intelligent action suggestions. For example, if a manager is viewing attrition risk analytics and wants to approve a retention bonus for a high-value employee, XAHA can pre-populate the approval request with relevant context, including the employee’s tenure, role, current compensation, and attrition risk score. This architecture creates a feedback loop where analytics insights drive actions, actions generate approval workflows, and completed approvals feed back into your analytics for tracking and ROI measurement. For comprehensive guidance on building your overall analytics strategy, review our enterprise HR analytics strategy framework for CHROs. Data Flow and Governance Understanding data flow is critical for implementing secure, auditable approval workflows. When an approval request is initiated from Power BI, the workflow captures the following information: the initiating user’s identity, the specific data context (which employee, which metric, which decision), the timestamp, and any supporting documentation. This data flows into your Power Automate workflow, which applies business logic rules (routing to the correct approver based on organizational hierarchy and approval thresholds). Once approved, the decision is logged in your approval audit trail and, depending on your workflow configuration, may trigger downstream actions in your HR systems (updating HRIS records, triggering compensation adjustments, etc.). Role-based access control is enforced at multiple levels. Managers only see Power BI reports containing data relevant to their organizational scope. The Power Automate workflow respects these boundaries, ensuring approval requests are routed only to authorized stakeholders. This multi-layer governance approach is essential for enterprise organizations and particularly important when handling sensitive HR data in regulated industries. Step 1: Create Your Power BI Report with Action-Ready Visuals Your approval workflow begins with a well-designed Power BI report that surfaces actionable insights and provides clear entry points for triggering approvals. Design Your Report Layout for Action Start